The e-SPU vs. UVXY Relationship is Nearing a Major Inflection Zone
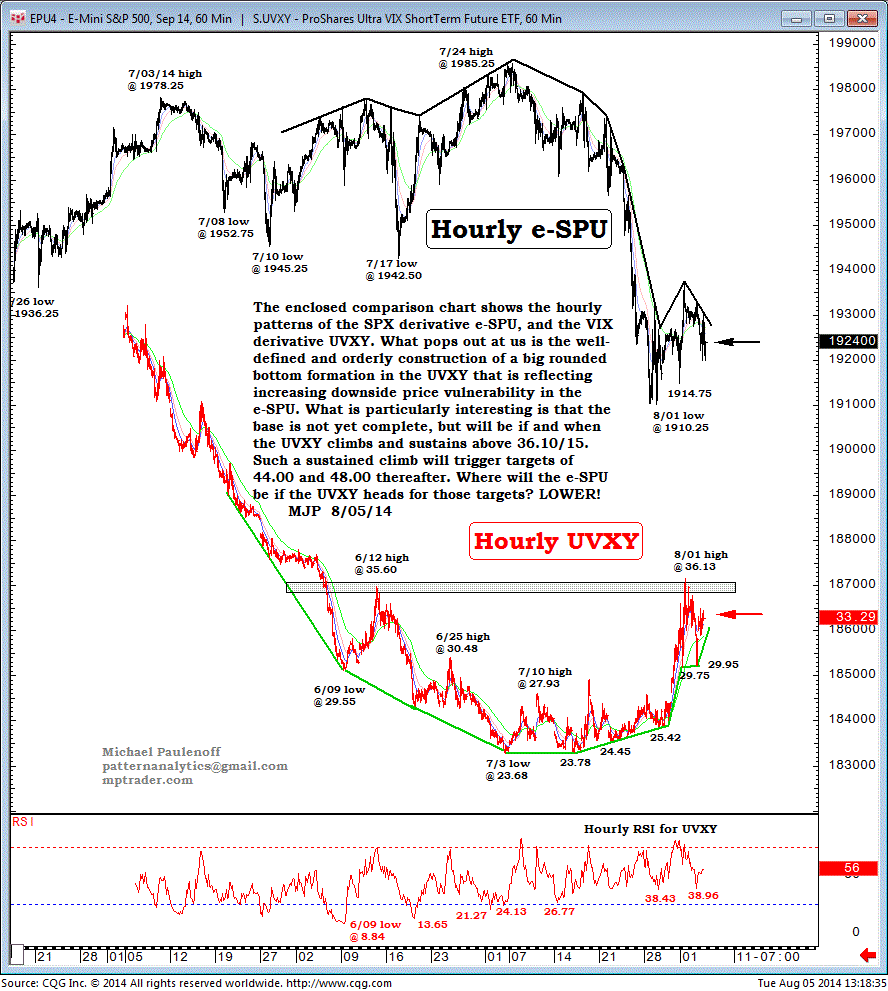
The enclosed comparison chart shows the hourly patterns of the SPX derivative e-SPU, and the VOLATILITY S&P 500 (VIX) derivative ProShares Ultra VIX Short-Term Fut ETF (UVXY).
What pops out at us is the well-defined and orderly construction of a big rounded-bottom formation in the UVXY that is reflecting increasing downside-price vulnerability in the eSPU..
What is particularly interesting is that the base is not yet complete, but will be if and when the UVXY climbs and sustains above 36.10/15.
Such a sustained climb will trigger targets of 44.00 and 48.00 thereafter.
Where will the e-SPU be if the UVXY heads for those targets?
LOWER!

