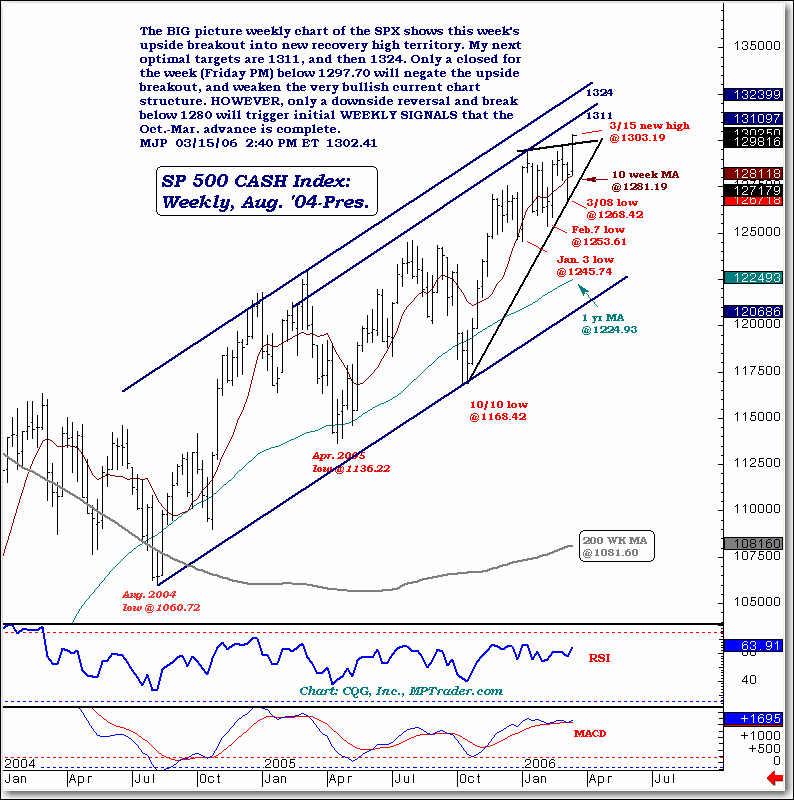
Upside Breakout in S&P 500
The BIG picture weekly chart of the SPX shows this week's upside breakout into new recovery high territory. My next optimal targets are 1311 and then 1324. Only a close for the week (Friday PM) below 1297.70 will negate the upside breakout and weaken the very bullish current chart structure. However, only a downside reversal and break below 1280 will trigger initial weekly signals that the Oct-Mar advance is complete.
For more of Mike Paulenoff, sign up for a Free 15-Day Trial to his Macro Trading Charts. Or try his QQQ Trading Charts or his E-mini S&P 500 Trading Diary.

