Very Long-Term View of the Cash SPX

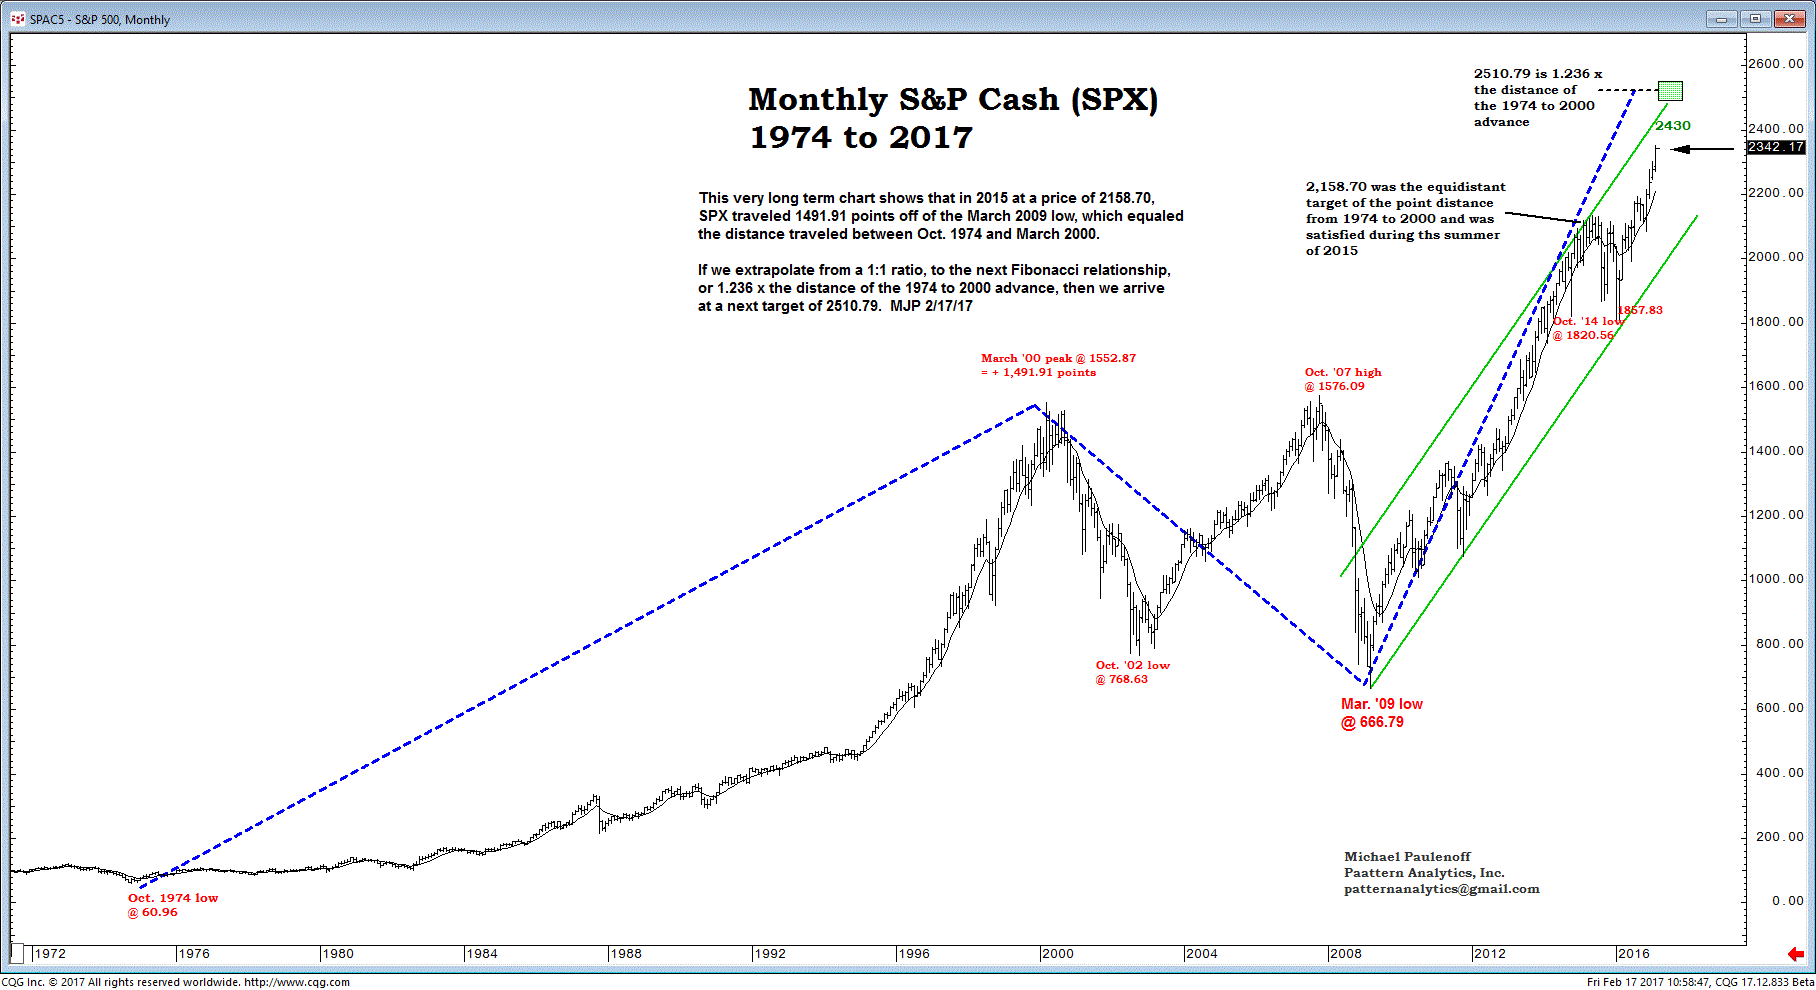
This very long-term chart shows that in 2015 at a price of 2158.70, S&P 500 (SPX) traveled 1491.91 points off of the March 2009 low, which equaled the distance traveled between Oct 1974 and March 2000.

If we extrapolate from a 1:1 ratio, to the next Fibonacci relationship, or 1.236 x the distance of the 1974 to 2000 advance, then we arrive at a next target of 2510.79.

  Matched
x
  • Action-Oriented Trade Set-Ups in Stocks & ETFs
  • Macro Analysis of the Broader Markets
  • Detailed Technical Guidance for each Trading Idea
  • Live Interaction w/ Mike & Our Member Community
  • And Much, Much More!
Join Now! - Special Offer!
Veteran Wall Street analyst and financial author, Mike provides detailed and timely analysis and trade set-ups on a range of markets. Read more...

Have Mike's “Out Front” morning analysis delivered FREE to your email inbox twice weekly!