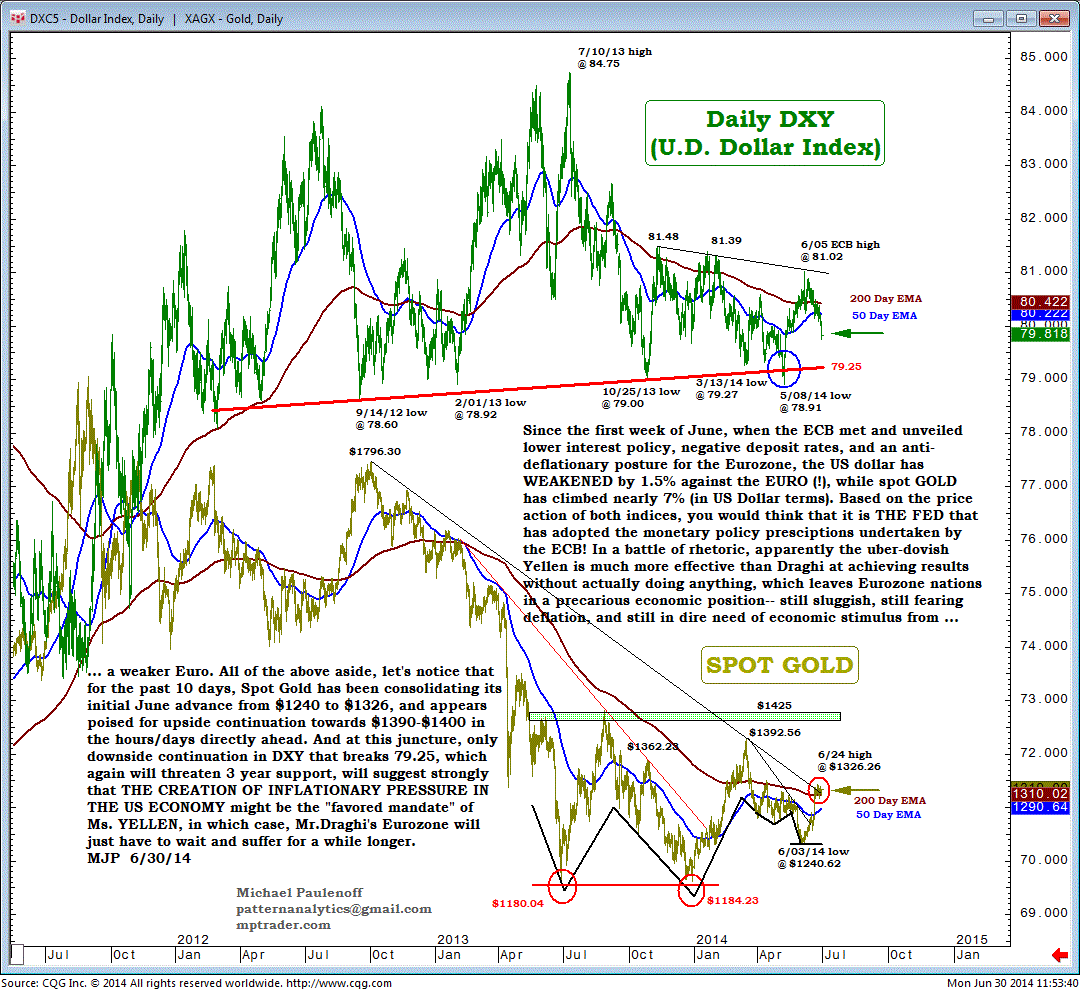
What are the DXY and GOLD Charts Telling Us, If Anything?
Since the first week of June, when the ECB met and unveiled lower interest policy, negative deposit rates, and an anti-deflationary posture for the Eurozone, the US dollar has weakened by 1.5% against the EURO (!), while spot Randgold Resources Limited has climbed nearly 7% (in US Dollar terms).
Based on the price action of both indices, you would think that it is the Fed that has adopted the monetary policy prescriptions undertaken by the ECB! In a battle of rhetoric, apparently the uber-dovish Yellen is much more effective than Draghi at achieving results without actually doing anything, which leaves Eurozone nations in a precarious economic position-- still sluggish, still fearing deflation, and still in dire need of economic stimulus from ...... a weaker Euro.
All of the above aside, let's notice that for the past 10 days, Spot Gold has been consolidating its initial June advance from $1240 to $1326, and appears poised for upside continuation towards $1390-$1400 in the hours/days directly ahead.
And at this juncture, only downside continuation in DXY that breaks 79.25, which again will threaten 3-year support, will suggest strongly that the creation of inflationary pressure in the US economy might be the "favored mandate" of Ms. YELLEN, in which case, Mr.Draghi's Eurozone will just have to wait and suffer for a while longer.

