Where Is Natural Gas Headed?
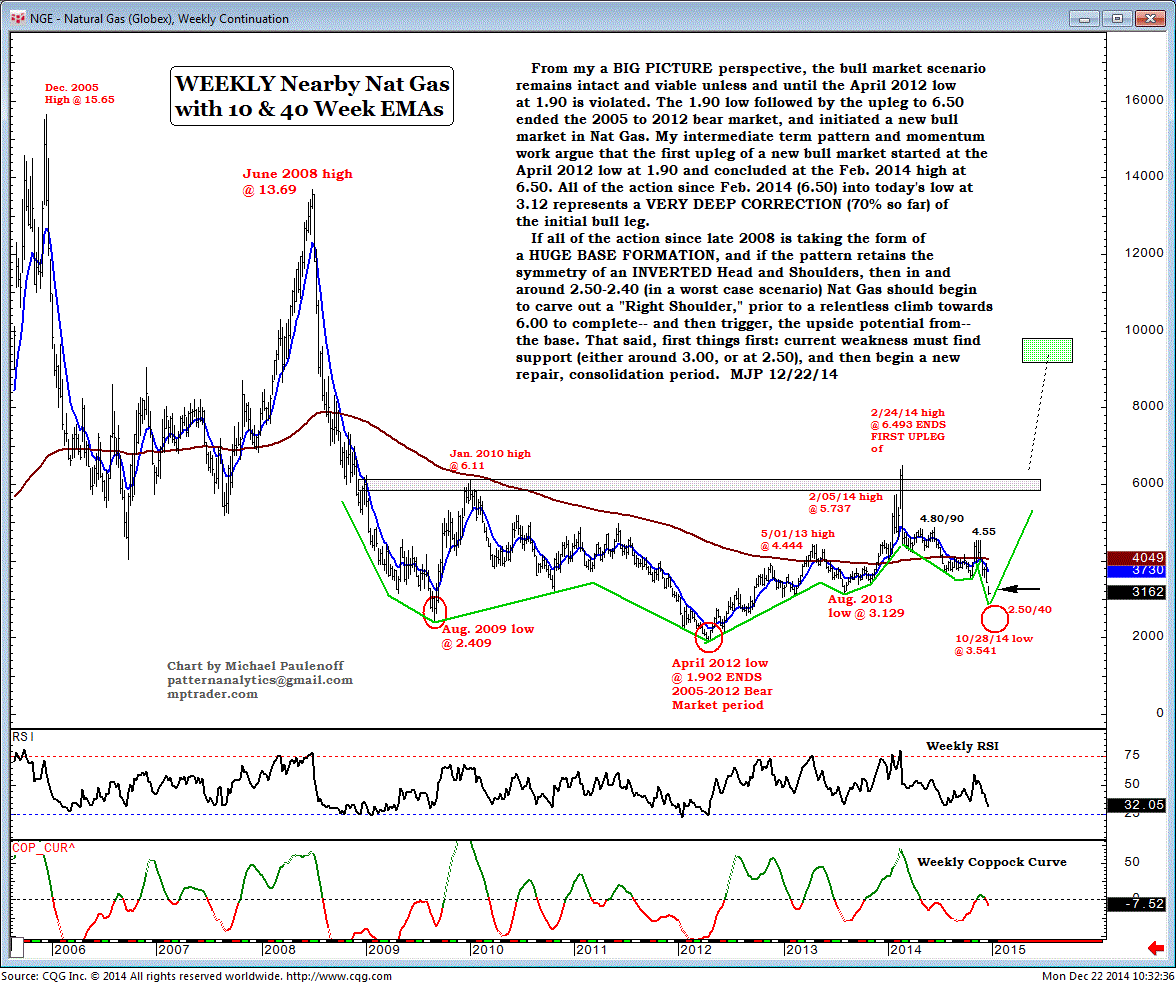
From my big picture perspective, the bull-market scenario remains intact and viable unless, and until, the April 2012 low at 1.90 is violated.
The 1.90 low, followed by the upleg to 6.50, ended the 2005 to 2012 bear market, and initiated a new bull market in Natural Gas.
My intermediate-term pattern and momentum work argue that the first upleg of a new bull market started at the April 2012 low at 1.90, and concluded at the Feb 2014 high at 6.50.
All of the action, since Feb 2014 (6.50) into today's low at 3.12, represents a very deep correction (70% so far) of the initial bull leg.
If all of the action since late 2008 is taking the form of a huge base pattern, and if the pattern retains the symmetry of an inverted head-and-shoulders, then in and around 2.50-2.40 (in a worst case scenario) Natural Gas should begin to carve out a "Right Shoulder," prior to a relentless climb towards 6.00 to complete--and then trigger, the upside potential from--the base.
That said, first things first: current weakness must find support (either around 3.00, or at 2.50), and then begin a new repair, consolidation period.