Year-End Big-Picture View of NYMEX Crude Oil
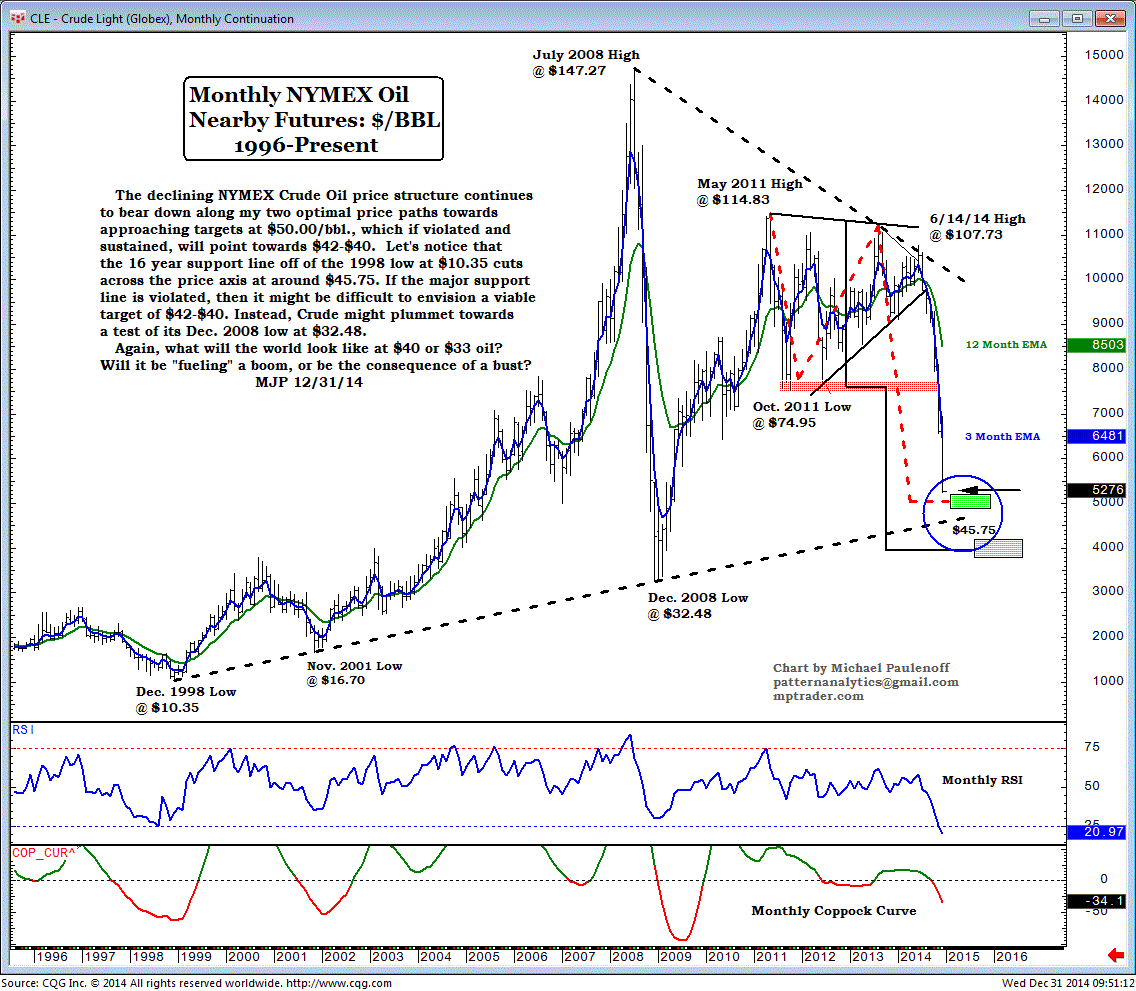
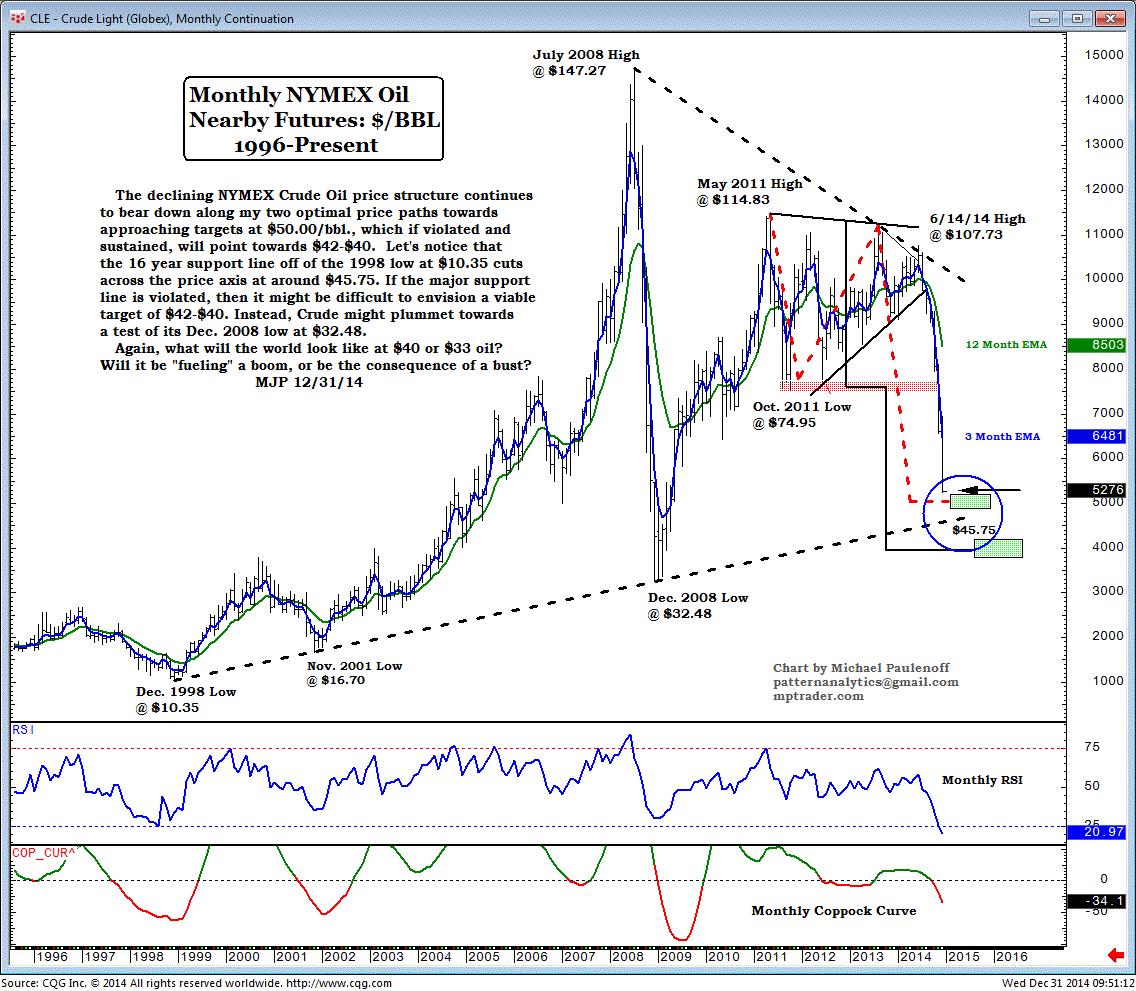
The declining NYMEX Crude Oil price structure continues to bear down along my two optimal price paths towards approaching targets at $50.00/BBL, which, if violated and sustained, will point towards $42-$40.
Let's notice that the 16-year support line, off of the 1998 low at $10.35, cuts across the price axis at around $45.75.
If the major support line is violated, then it might be difficult to envision a viable target of $42-$40.
Instead, crude might plummet towards a test of its Dec 2008 low at $32.48.
Again, what will the world look like at $40 or $33 oil? Will it be "fueling" a boom, or be the consequence of a bust?


