e-SPH Gyrates Beneath Key Resistance
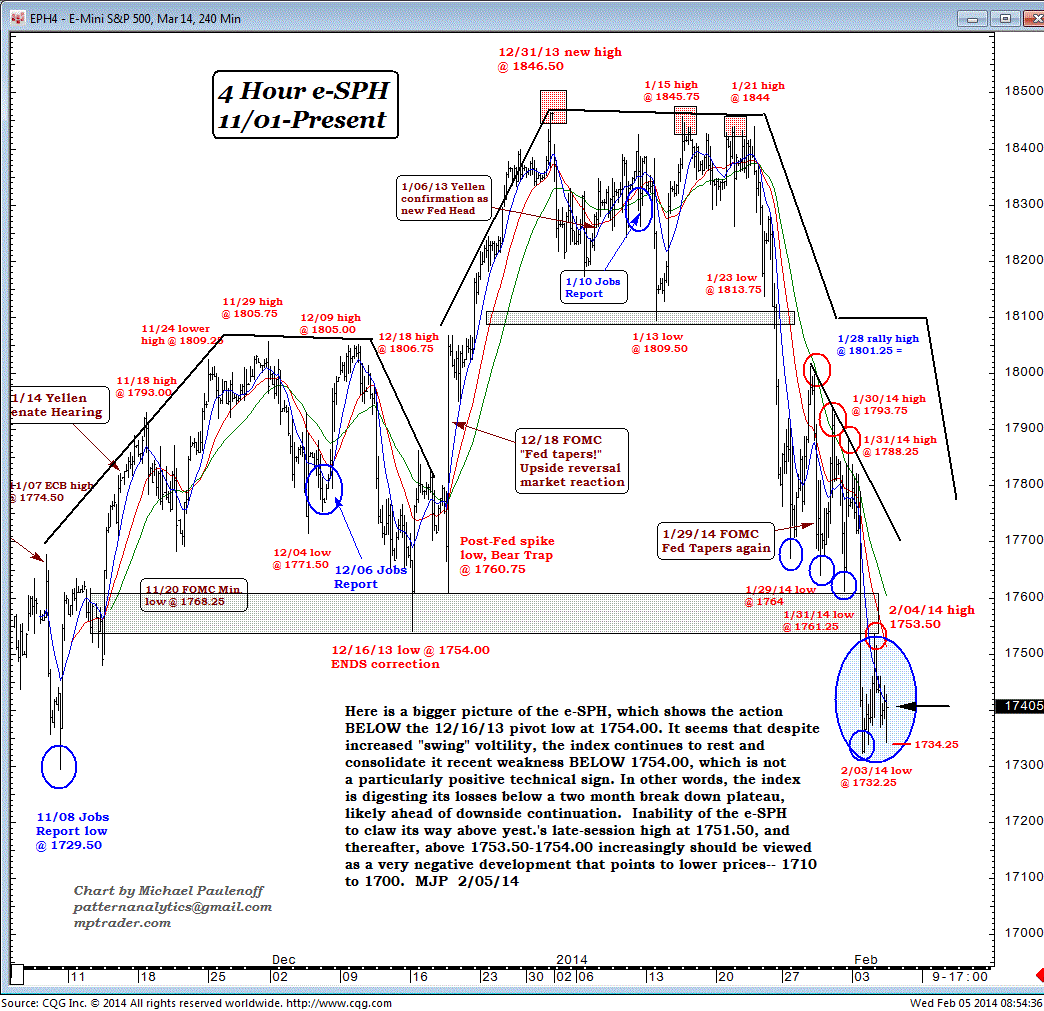
Here is a bigger picture of the e-SPH, which shows the action below the Dec 16, 2013, pivot low at 1754.00.
It seems that despite increased "swing" volatility, the index continues to rest and consolidate its recent weakness below 1754.00, which is not a particularly positive technical sign.
In other words, the index is digesting its losses below a two-month break-down plateau, likely ahead of downside continuation.
Inability of the e-SPH to claw its way above yesterday's late-session high at 1751.50, and thereafter, above 1753.50-1754.00 increasingly should be viewed as a very negative development that points to lower prices, 1710 to 1700.

