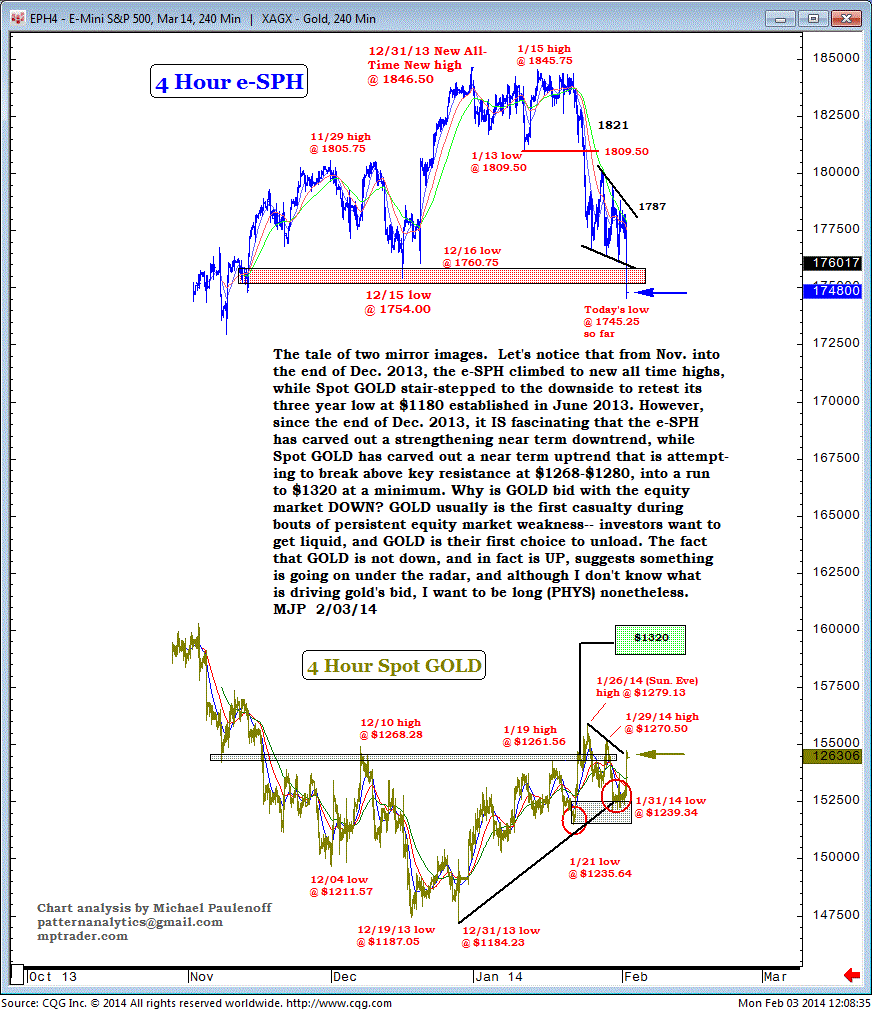
e-SPH and Spot Gold Exhibit Inverse Chart Patterns
The tale of mirror images.
Let's notice that from Nov into the end of Dec 2013, the e-SPH climbed to new all-time highs, while Spot Gold stair-stepped to the downside to retest its three year low at $1180 established in June 2013.
However, since the end of Dec 2013, it is fascinating that the e-SPH has carved out a strengthening near-term downtrend, while Spot Gold has carved out a near-term uptrend that is attempting to break above key resistance at $1268-$1280, into a run to $1320 at a minimum.
Why is Gold bid with the equity market down?
Gold usually is the first casualty during bouts of persistent equity market weakness-- investors want to get liquid, and Gold is their first choice to unload.
The fact that Gold is not down, and in fact is up, suggests something is going on under the radar, and although I don't know what is driving gold's bid, I want to be long Sprott Physical Gold Trust ETV (PHYS) nonetheless.

