Market Analysis for Feb 3rd, 2021

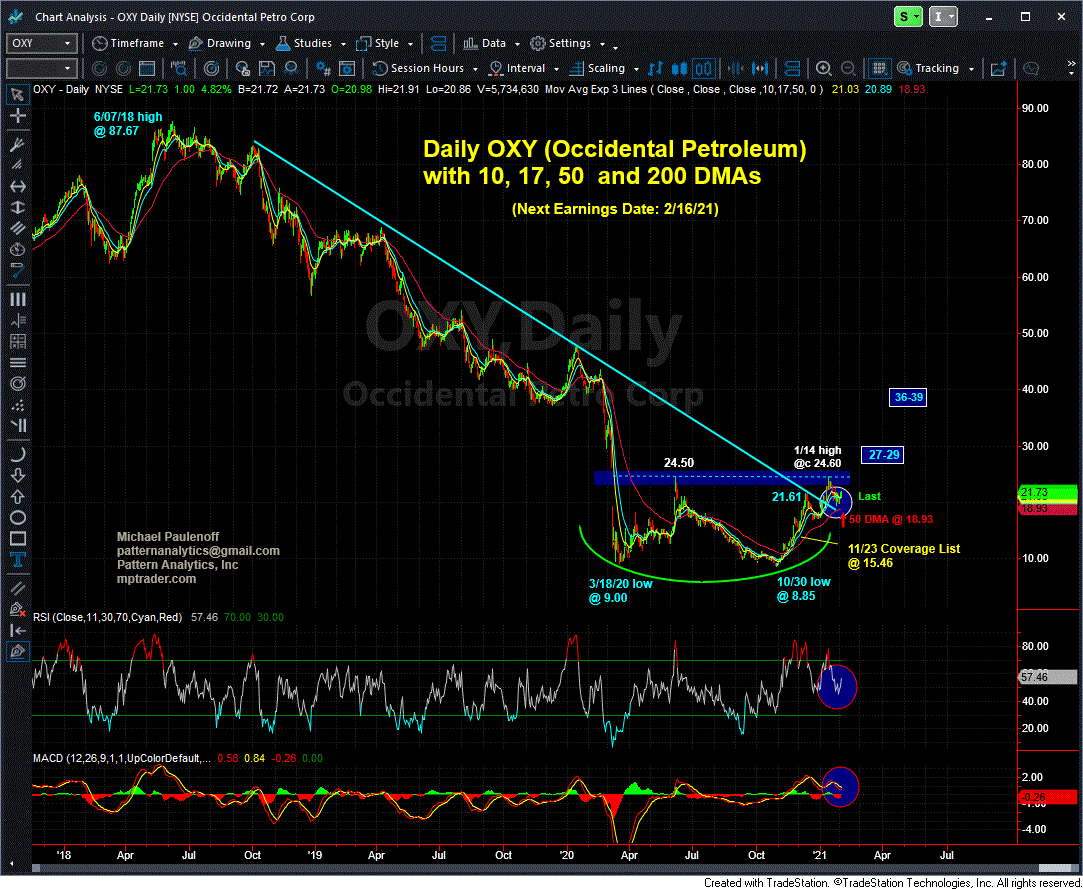
OXY (Occidental Petroleum)-- has a near term chart structure that argues its correction from the 1/14 rally high at 24.60 ended at 19.46 last Wed., and since, the stock has turned up into a new upleg that will make a run at 24.60, and if (when) taken out, will project next to 27-29, in route to 36-39. As long as any forthcoming weakness is contained above the up-sloping 50 DMA, now at 18.93, OXY will remain in strong technical condition... Last is 21.76/77

2 03 OXY Daily GIF
2 03 OXY Daily GIF

  Matched
x
  • Action-Oriented Trade Set-Ups in Stocks & ETFs
  • Macro Analysis of the Broader Markets
  • Detailed Technical Guidance for each Trading Idea
  • Live Interaction w/ Mike & Our Member Community
  • And Much, Much More!
Join Now! - Special Offer!
Veteran Wall Street analyst and financial author, Mike provides detailed and timely analysis and trade set-ups on a range of markets. Read more...

Have Mike's “Out Front” morning analysis delivered FREE to your email inbox twice weekly!