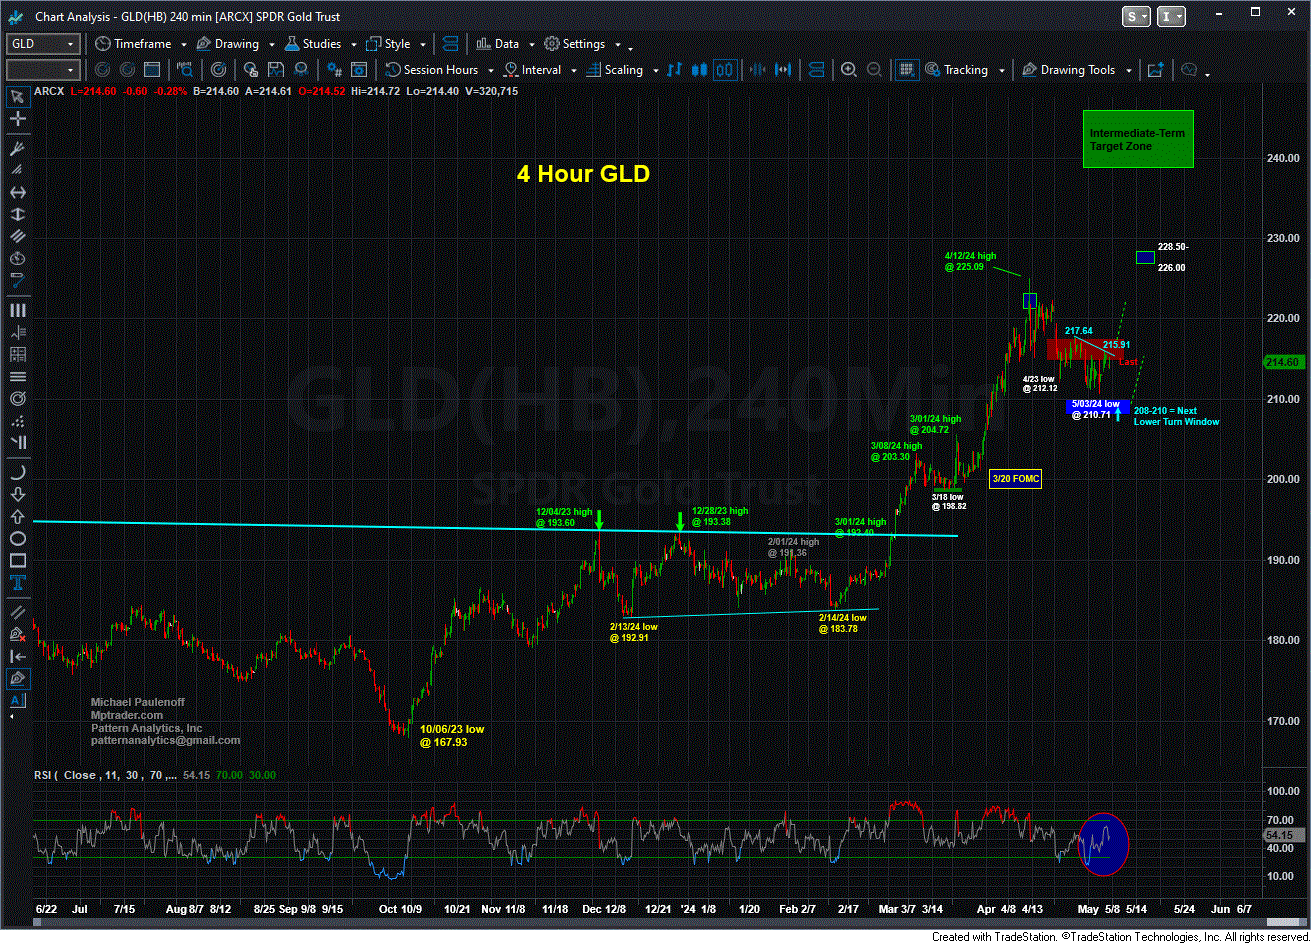
4-Hour GLD Chart

GLD--  My near-term pattern work argues that GLD ended a correction from its 4/12 high at 225.09 to the 5/03 low at 210.71. All of the action since last Fri's low at 210.71 into the 216 level has the right look of the initiation of a new upleg or a rally that should revisit the 221-225 April high-zone... Last is 214.64...

  Matched
x
  • Action-Oriented Trade Set-Ups in Stocks & ETFs
  • Macro Analysis of the Broader Markets
  • Detailed Technical Guidance for each Trading Idea
  • Live Interaction w/ Mike & Our Member Community
  • And Much, Much More!
Join Now! - Special Offer!
Veteran Wall Street analyst and financial author, Mike provides detailed and timely analysis and trade set-ups on a range of markets. Read more...

Have Mike's “Out Front” morning analysis delivered FREE to your email inbox twice weekly!