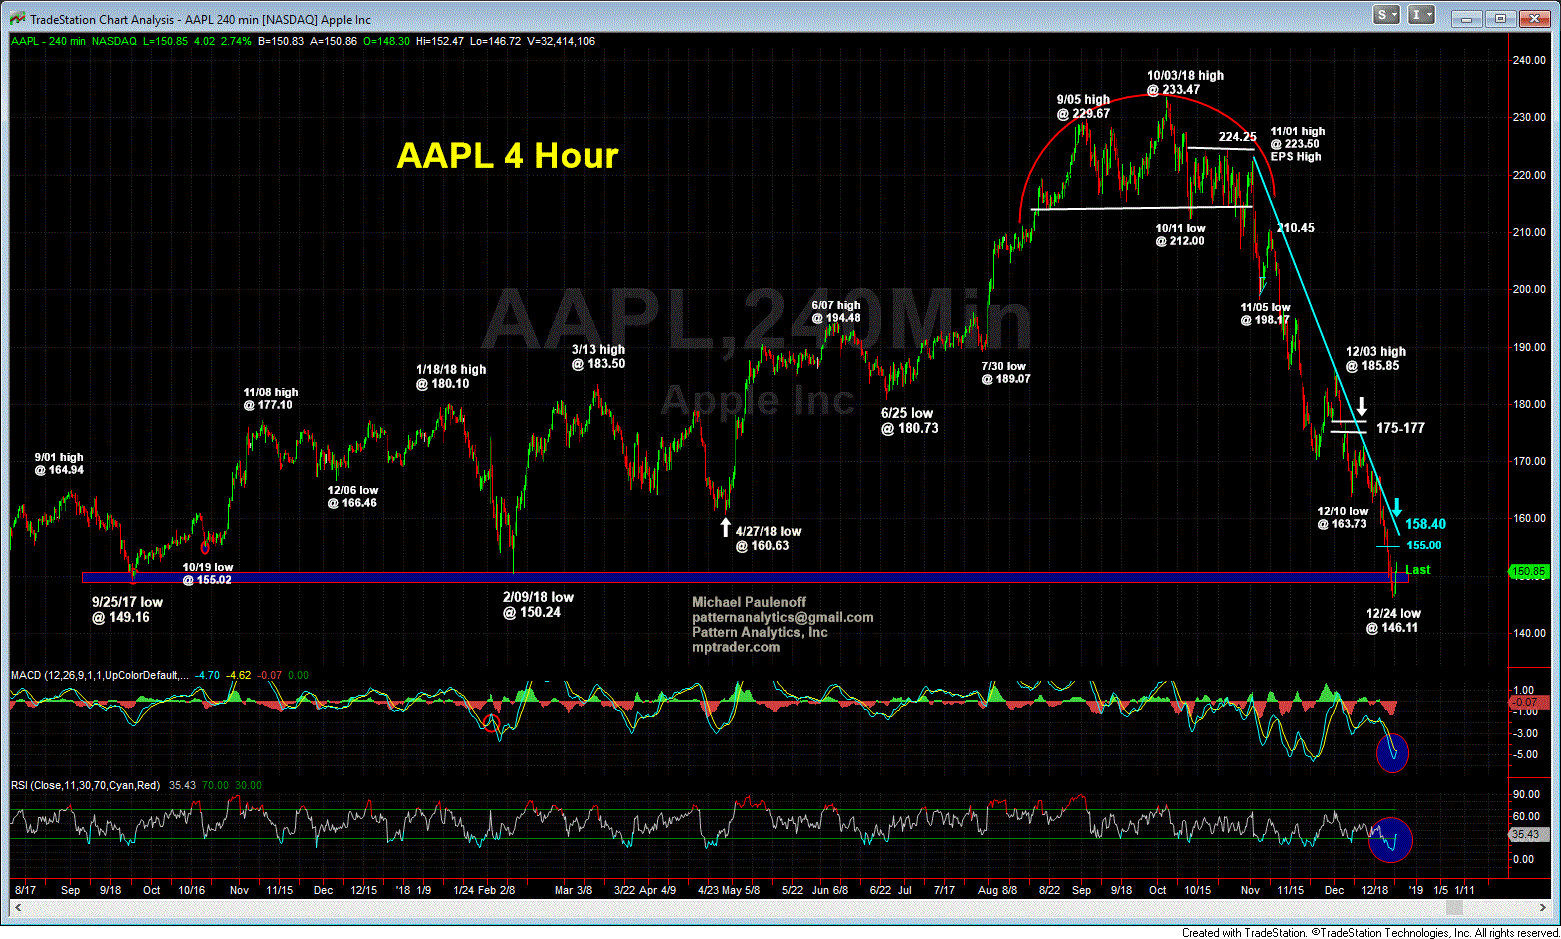
AAPL Exhibits a Promising Near Term Technical Set Up
AAPL presents an interesting near term set up. Let's notice that this past Monday (12/24) during the pre-holiday half session, it traded down to 146.11, breaking BOTH its February 2018 low at 150.24 and its Sep. 2017 low at 149.16, BUT failed to follow-through to the downside. Instead, AAPL has climbed to an intraday high at 152.46 so far today, leaving behind a Bear Trap low followed by a 4.3% rally that exhibits bullish form.
The combination of a Bear Trap low, a rally that exhibits bullish form, and an extremely oversold near term condition is a set up that argues for additional recovery that projects next to 153.50/80, in route to 158-160 thereafter to test the dominant down trendline off of the 11/01 EPS downside pivot reversal.
Our Model Portfolio is long AAPL at 149.15 from Monday (12/24)... Last is 151.83

