After CPI and PPI, Next Up is Retail Sales
Mptrader Out Front: Friday May 14th, 2021
At 8:30 AM ET, we get the latest official data on Retail Sales for April. The Street is expecting Retail Sales to show a 1% after March's outlier climb of 9.8%. Ex-autos, The Street expects +0.7% vs. +8.4%, and for the Year-Over-Year comparison, well, the expectation is that the April 2021 figures for Retail Sales will be 30.5% higher than the pandemic month of April 2020...
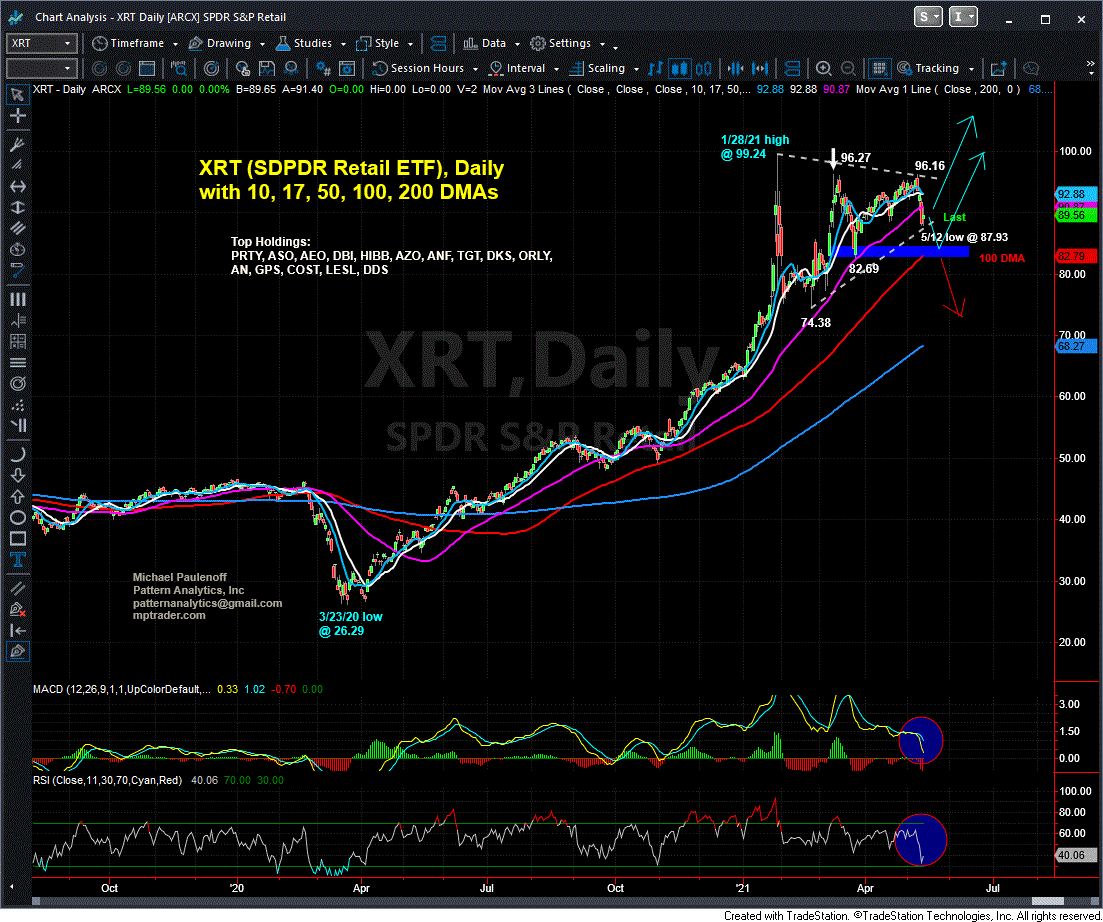
As for the Retail Sector of the market, my attached chart of the XRT (SPDR S&P Retail ETF) shows gargantuan 277% climb from the March 2020 low at 26.29 to the Jan. 28, 2021 high of 99.24. The gain no doubt reflects Fed and fiscal policy intervention that turbo-boosted both equity market liquidity and "spending money" for more than 250 million American's.
That said, however, it IS interesting that XRT has traveled sideways, in a contracting range pattern for the past 10 weeks. Why? Maybe the latest round of stimulus payments and checks have yet to find their way into the cash registers of businesses, but if that is the case, the rapid reopening these days should remedy the pause in spending.
In addition, if inflationary expectations are picking up (aided by this week's headline figures in CPI and PPI), then consumers will start to accelerate their spending on big ticket items like cars, refrigerators, and furniture because their mindset will morph into one that whispers, "if we don't buy sooner, then the price likely will be higher later."
If I overlay the above considerations on top of the attached Big Picture Chart of XRT, my conclusion technically is that all of the action from the Jan. 28th high at 99.24 through Tuesdays (May 12th) higher pullback low, represents a larger, bullish digestion period and pattern atop the dominant 15 month uptrend.
In addition, based on my experience, the Coil type pattern that has been carved out has the requisite number of traverses across the contracting range to be considered complete or nearly complete, which if reasonably accurate, argues for the emergence of a new upleg in the XRT that propels the Retail ETF to new highs above 100, with an outlier upside target zone of 108 to 112.
At this juncture, a only a sustained breach of 87.93 on a closing basis will delay the initiation of the expected next upleg, and instead will focus attention of 82.70/80 critical support level which must NOT be violated if the post-Jan. period is to be considered a bullish digestion period rather than a developing mayor top... Last in pre-market is 89.56

