Another Head & Shoulders Head Fake!
Last week, in our discussion of the price behavior of AMD, we reviewed the downside failure of a massive Head & Shoulders Top formation and the equal, but opposite, reaction of AMD on the upside in the event that strength exceeded the peak of the right shoulder. AMD, indeed, rocketed above the peak of the right shoulder (albeit with the aid of the Reddit crowd).
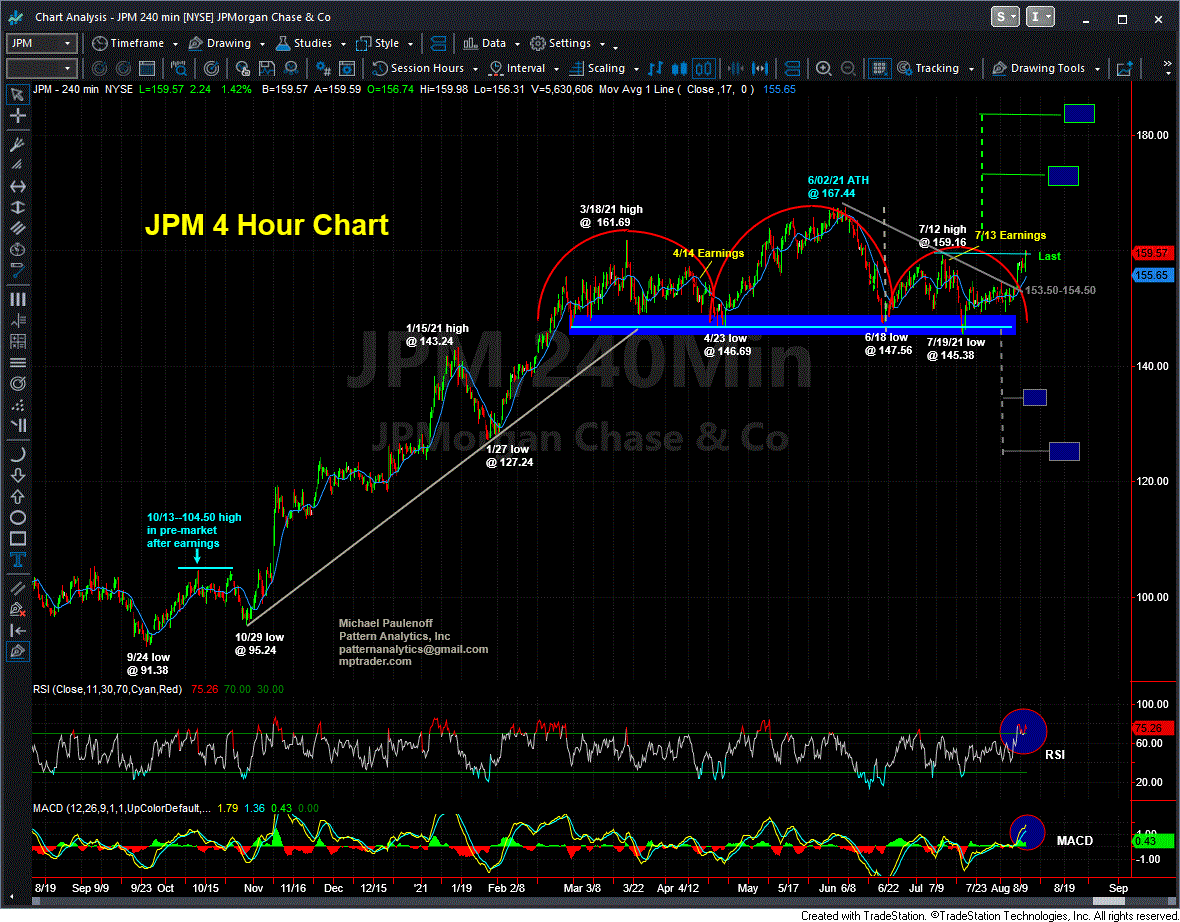
In a similar pattern setup, let's have a look at JPM. My 4-Hour chart shows that in late July and early August, JPM probed the neckline support plateau of a 4-month distribution top formation, but failed to break down.
Instead, JPM pivoted to the upside and has climbed enough to recover the entire width of the right shoulder from 146 to 159, and today, in fact, has climbed above the peak of the right shoulder, which triggers additional upside reversal signals.
The reversal signals indicate upside continuation representing a climb off the peak of the right shoulder that will be 60% to 100% of the distance from the head to the neckline. Should such a scenario unfold, JPM has a new upside targets in the vicinity of 173 and then possibly into the 180 to 182 area.
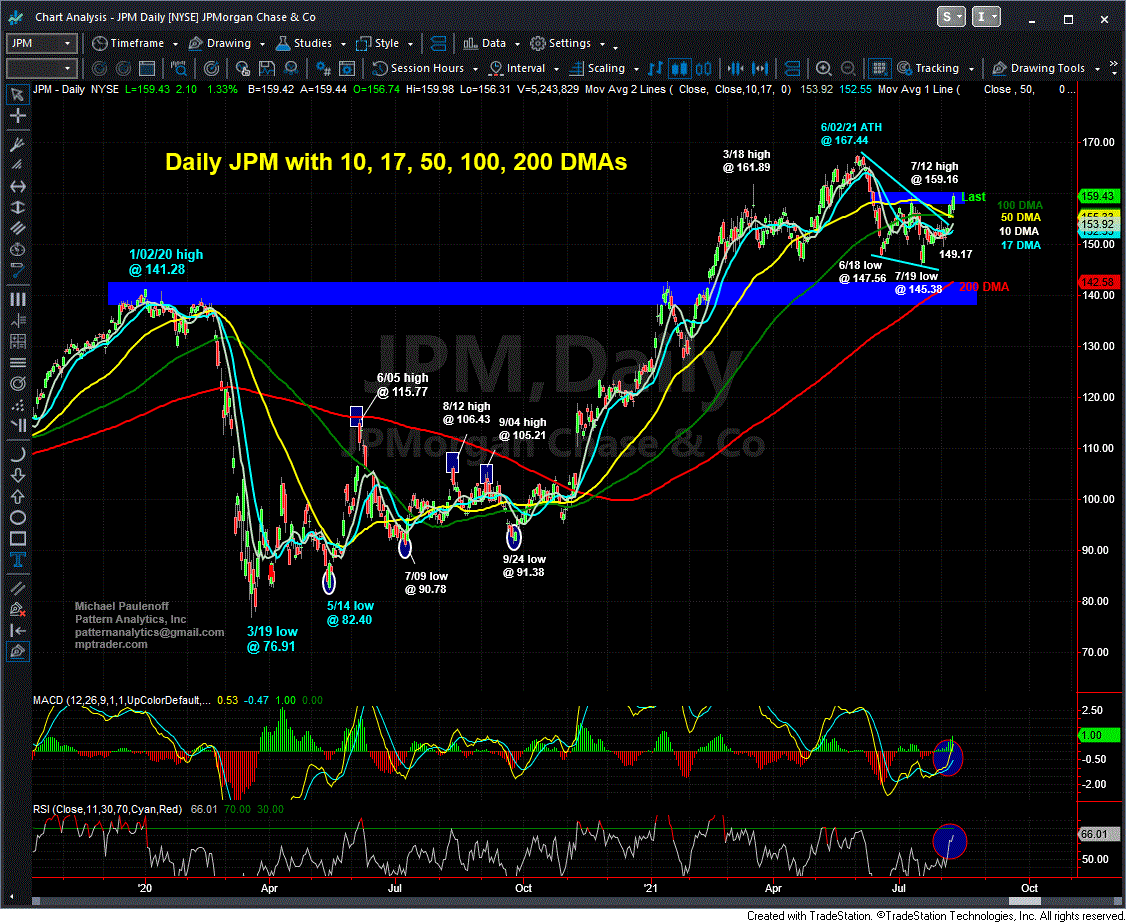
I have also included my big picture Daily Chart of JPM to show where the near-term setup fits into the larger, post-2020 low advance. Let's notice that the entire March-August distribution top period held and turned up from just above the up-sloping 200 DMA (142.58).
While my bullish outlook for JPM (along with the XLF) argues for new all-time highs, from a pattern perspective should JPM climb to a new ATH above 167.44, the current up-leg will satisfy the minimum requirement for the conclusion of the major bull move from the March 2020 low at 76.91.
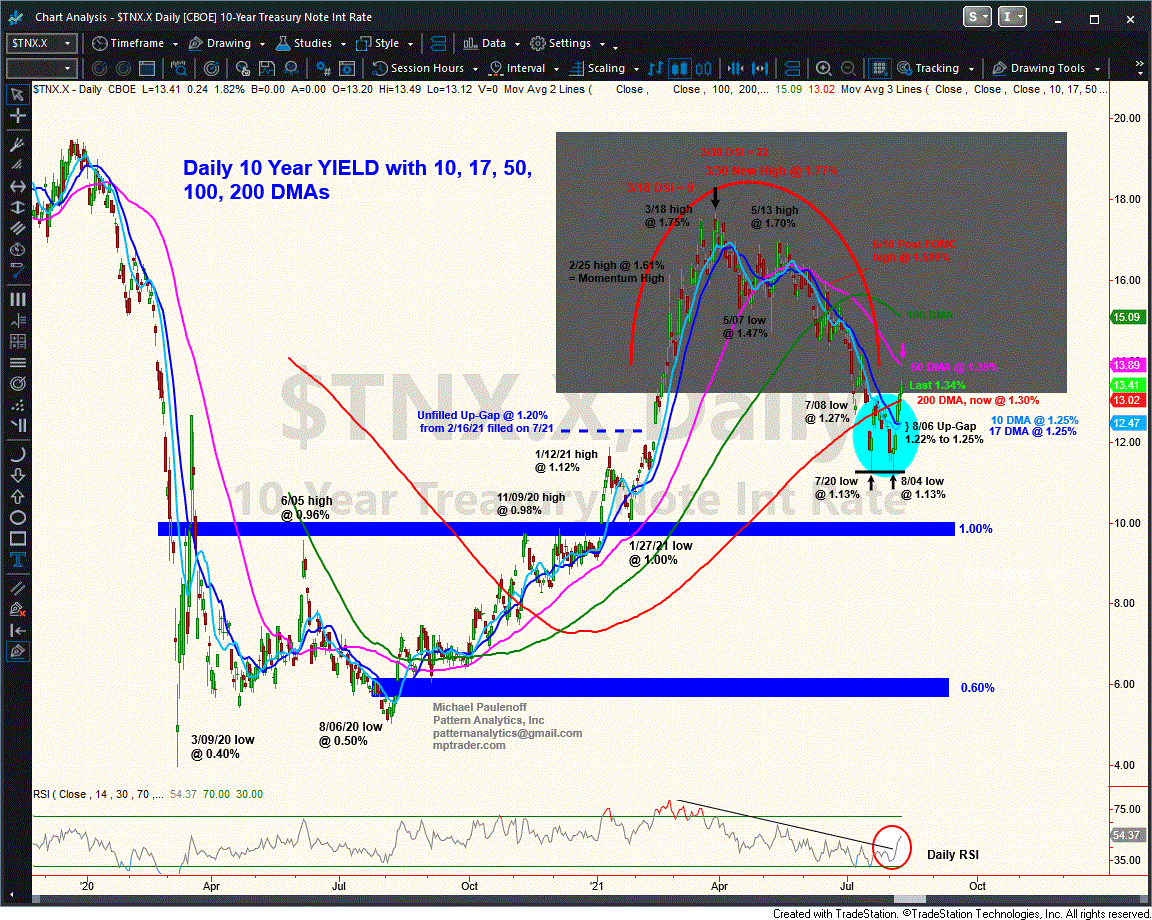
Perhaps one of the driving forces of a powerful up-move in the big banks is the upside reversal in 10-year Treasury YIELD, shown on my Daily Chart. YIELD has put in a significant July-August double bottom Low at 1.13%, and has climbed sharply off of the lows to 1.35% (+19%) in just the last 4 sessions. It's as if if Mr. Market now believes it has enough information and evidence to conclude that macro, monetary, and fiscal conditions warrant higher interest rates. (Fed be damned!)
Whatever the background story is or becomes, at the moment JPM (reflecting bullishly on the XLF) exhibits a setup that argues for upside continuation of 8% to 14% in the upcoming days and weeks.
Only a bout of weakness that presses JPM beneath 153.50 on a closing basis will compromise the developing bullish technical set up. Last is 159.10. Last in YIELD is 1.34%.


