Apple Testing Important Support
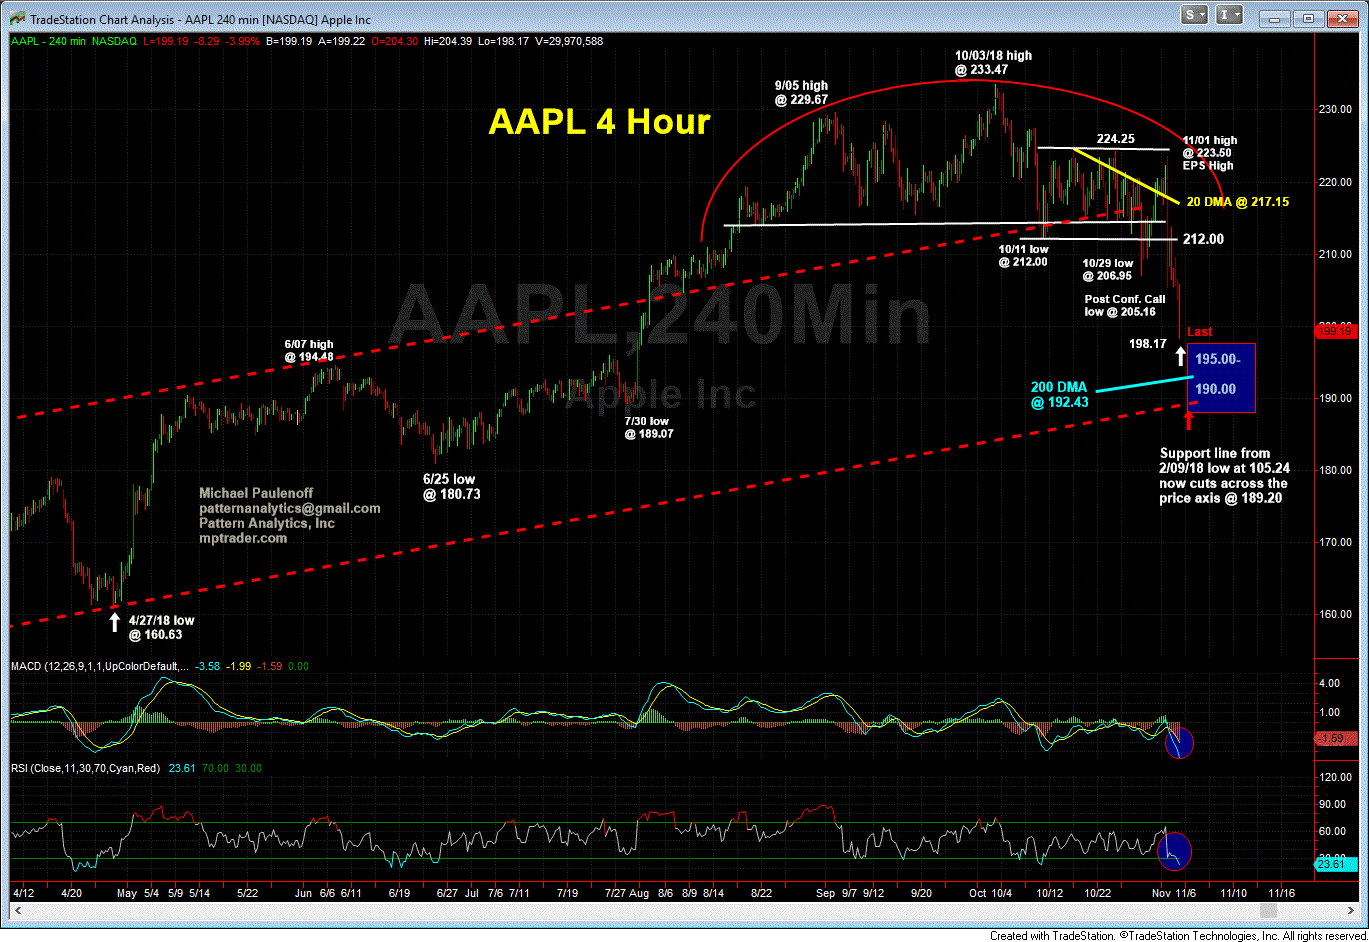
AAPL-- hit a corrective low this AM at 198.17, which represents a 15% correction off of its 10/03/18 high at 233.47. Let's notice on the attached 4 hour chart that AAPL weakness has pressed into the area of an important cluster of support between 195 and 190, which includes 1) the measured downside swing objective from its Sep.- OCt. top formation, 2) the up-sloping 200 DMA, now at 192.43, and 3) its support line from the 2/09/18 low at 105.24, which cuts across the price axis today in the vicinity of 189-190. Although AAPL has bounced from 198.17 to 201.00 in the past 20 minutes, it needs to climb above 203.50-204.50 to trigger initial nearest term buy signals, and then follow-through above 206.50 to put in a significant near term upside technical reversal... Last is 200.91/94

