
Are We There Yet, At The Elusive Peak In The S&P 500?
 By
Mike Paulenoff
By
Mike Paulenoff
Perhaps, but only if BOTH the Powell Fed AND mega-tech earnings disappointments hose the red-hot index with ice water this week...
Since last November 29th, when I posted an article elsewhere indicating that an "immovable Force equal to or greater than the dominant, powerful post-October 2023 uptrend was neither present nor emerging," the S&P 500 has climbed from 4550.58 to a new all-time high at 4906.69 (+7.8%) on January 26th.
Along the way, stubborn index strength defied exceedingly bullish sentiment precipitated by the December 13th FOMC meeting that — justified or not — shifted investor perceptions toward a more accommodative Fed policy stance, strengthened expectations for a Goldilocks economic soft landing, and recalibrated the bullish price trajectory despite an overbought technical condition.
Smooth sailing, no doubt. Wait just a minute, maybe not?
This week the equity markets will have to process potentially destabilizing information about how much money the Treasury will need to borrow for Q1, 2024 to meet the needs of the Federal Government (and the duration of debt the Yellen Treasury intends to sell), a Fed meeting and policy statement on Wednesday (January 31st), and several AI, mega-tech corporate earnings reports!
What could go wrong?
— The Treasury announcements could send a shockwave through the bond market, backing up longer-term yields…
— The Fed could go out of its way to tamp down current enthusiasm for a sooner rather than a later rate cut…
— And MSFT, GOOG, AMD, AAPL, AMZN, and META earnings and/or business outlook could disappoint investors, triggering an exodus from those juggernaut mega-tech names.
When I overlay my work on top of this macro and micro minefield, however, I conclude, “Prove it to me! I will believe it when I see actual technical damage!”
A Look At The Bullish Charts
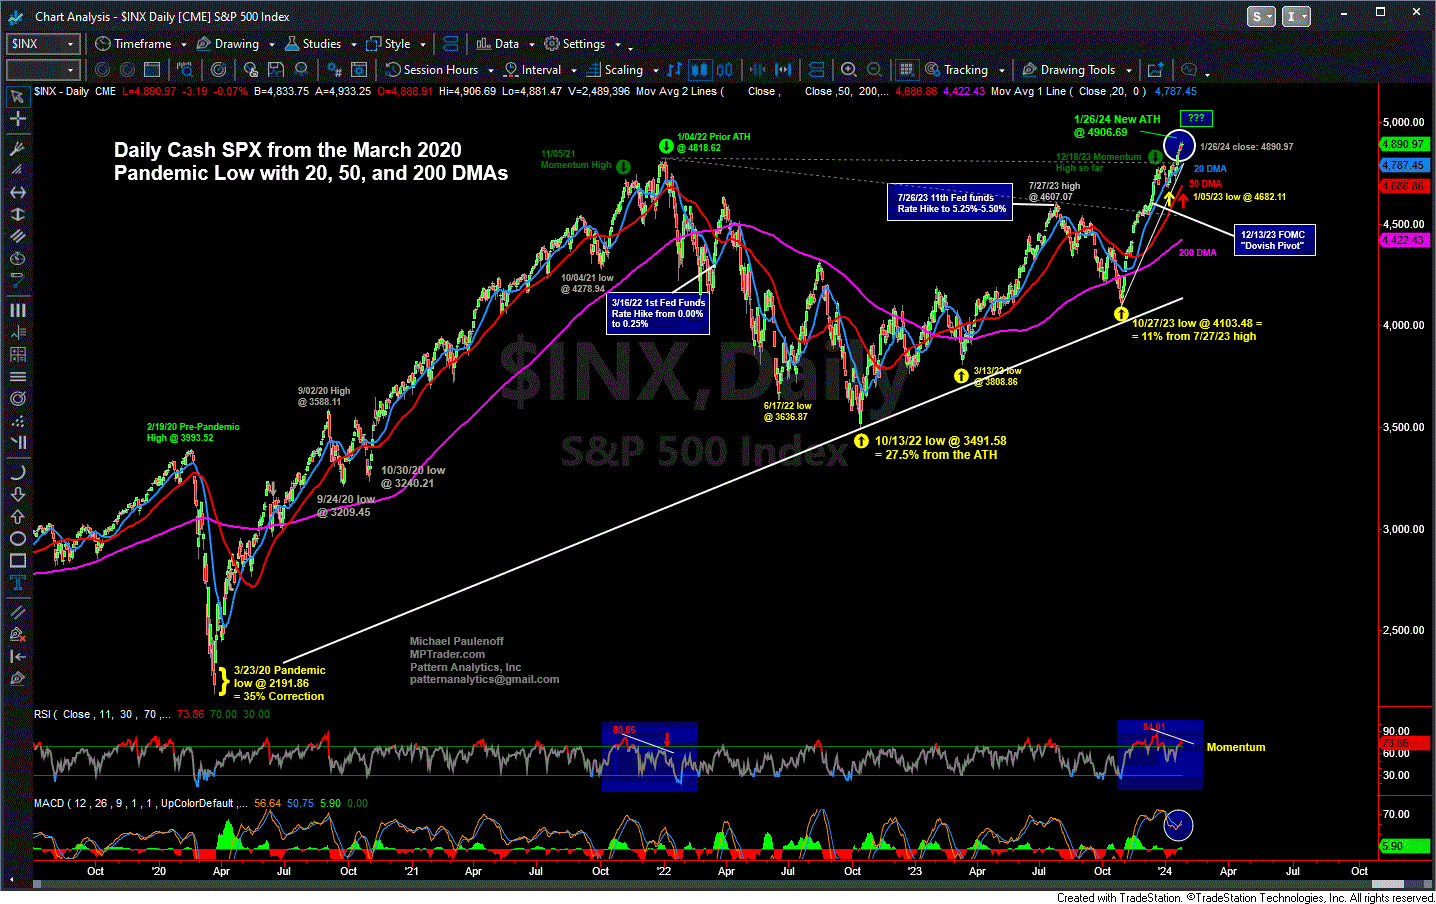
For example, from a big-picture perspective, my daily chart of the cash SPX exhibits an extremely powerful uptrend pattern off of the October 27, 2023 pivot low at 4103.48. Only a downside reversal that violates and sustains beneath support lodged from 4770 down through 4680 (-3% to -4.7%) will inflict serious technical damage and will lock in a currently developing negative momentum divergence shown at the bottom of the chart.
That said, however, in the absence of a damaging downside reversal, my daily cash SPX setup points to 5000 next.
TradeStation
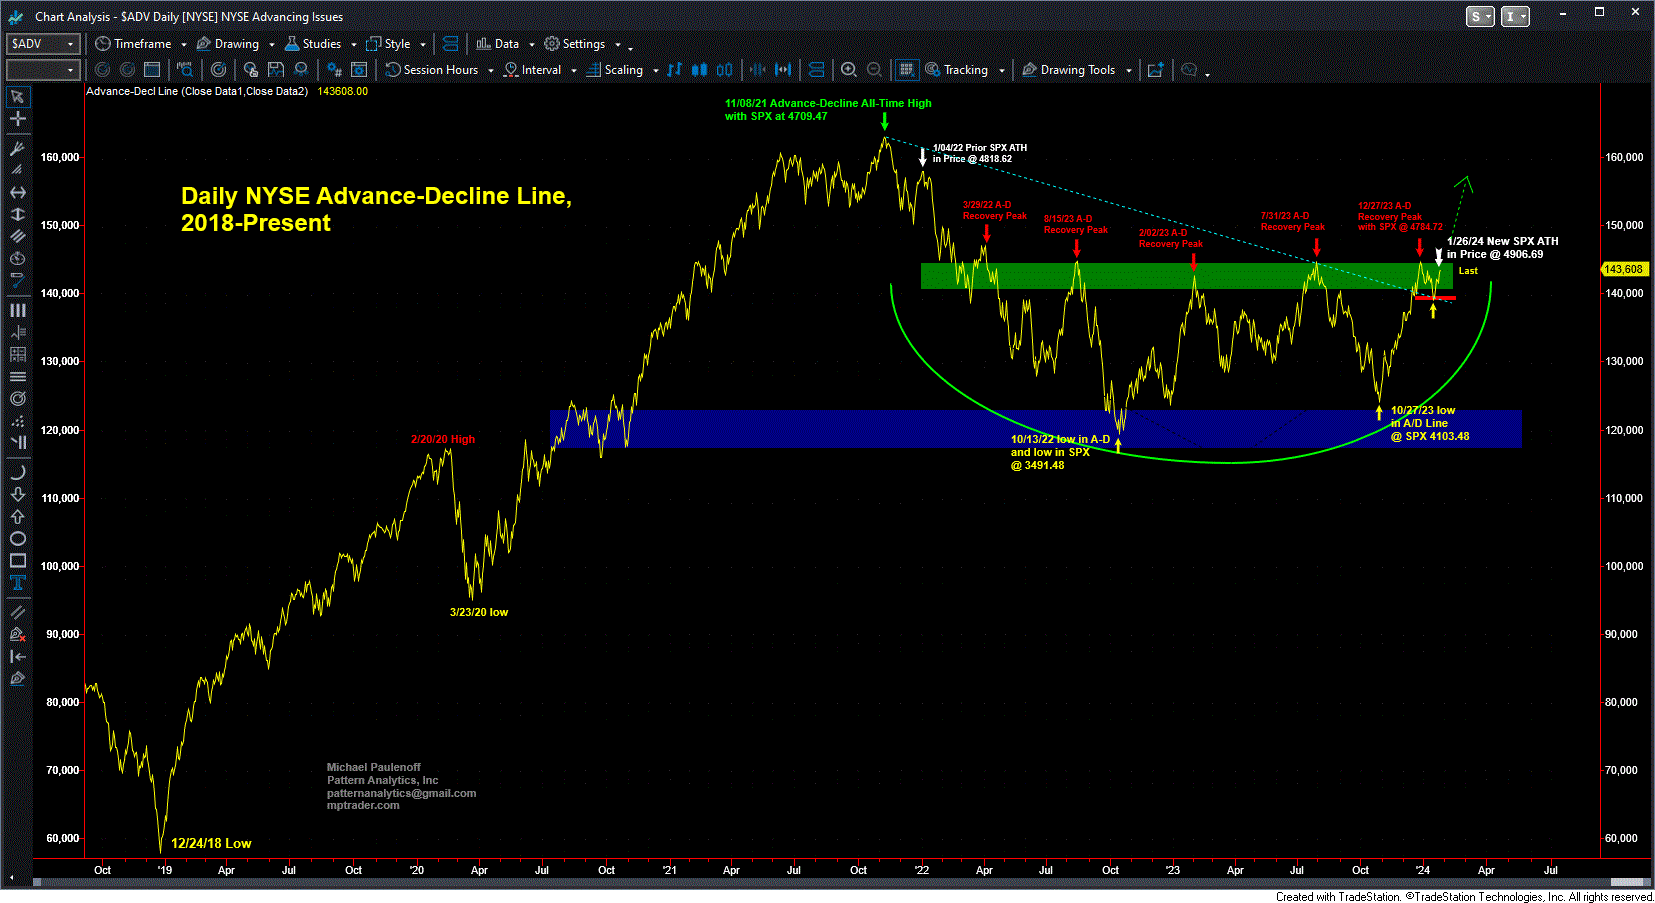
From the standpoint of market breadth, I can make a compelling case that the pattern carved out by the Cumulative A-D Line is about to emerge to the upside from a 27-month accumulation period that, if triggered, will represent a meaningful expansion in the non-Magnificent-7 portion of the SPX 500.
For the last 12 months, the Magnificent 7 mega-tech names of Apple, Microsoft, Alphabet, Amazon, Nvidia, Meta, and Tesla have enjoyed a total return of 26% compared with the “other 493 names” in the index that have a combined average return of just 11.4%. In other words, the “other 493 names” have a lot of catching up to do.
The technical setup of my Cumulative A-D chart suggests strongly that just such a period could be directly ahead.
TradeStation
Powerful Uptrends In AAPL and MSFT
It just so happens that five of the Magnificent 7 mega-tech names are reporting earnings this coming week (Tesla already reported disappointing earnings last Wednesday January 24th, but the results failed to derail the bull trend of the larger SPX Index), which certainly have the potential to impact the setup exhibited on my aforementioned Cumulative A-D Chart.
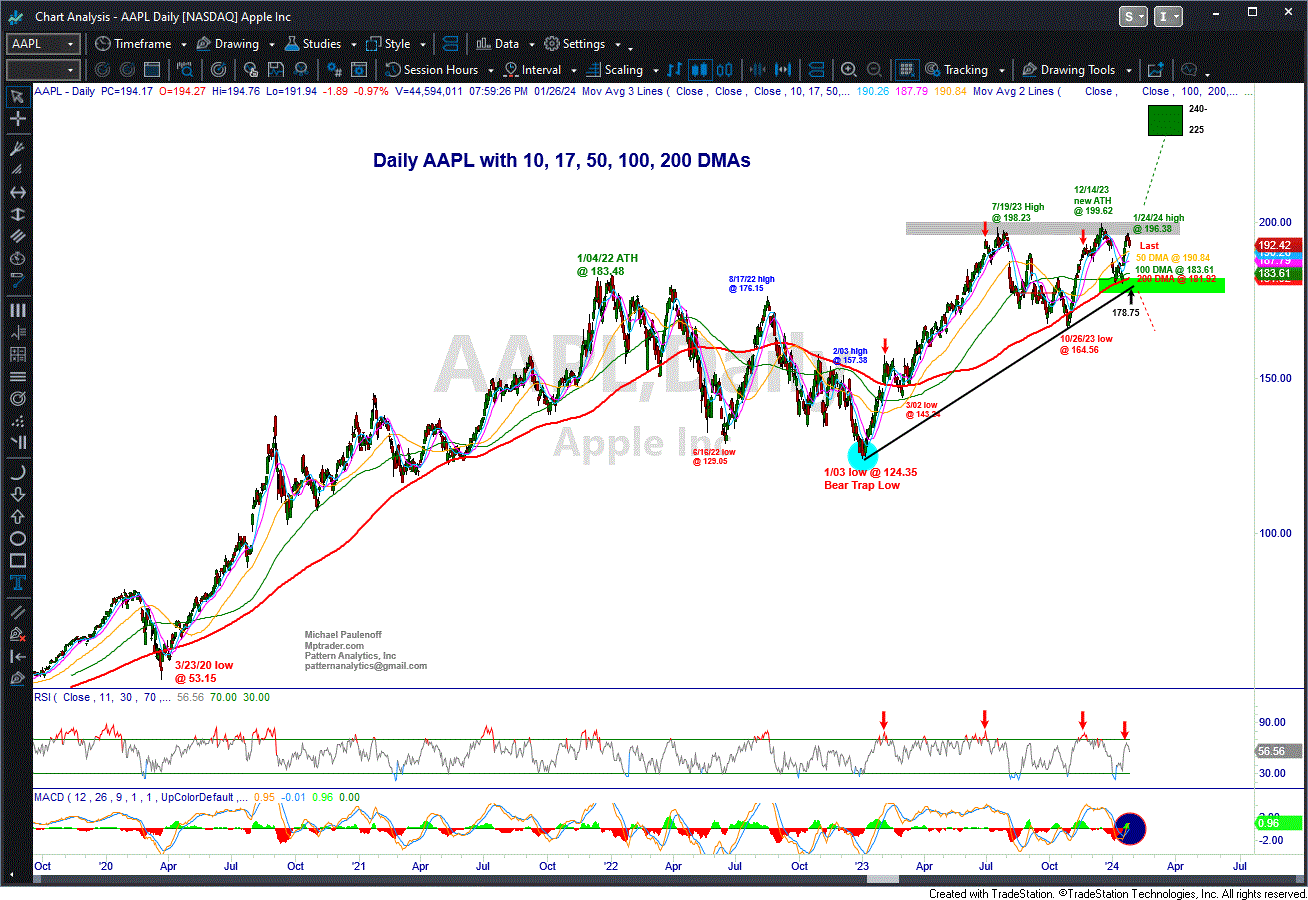
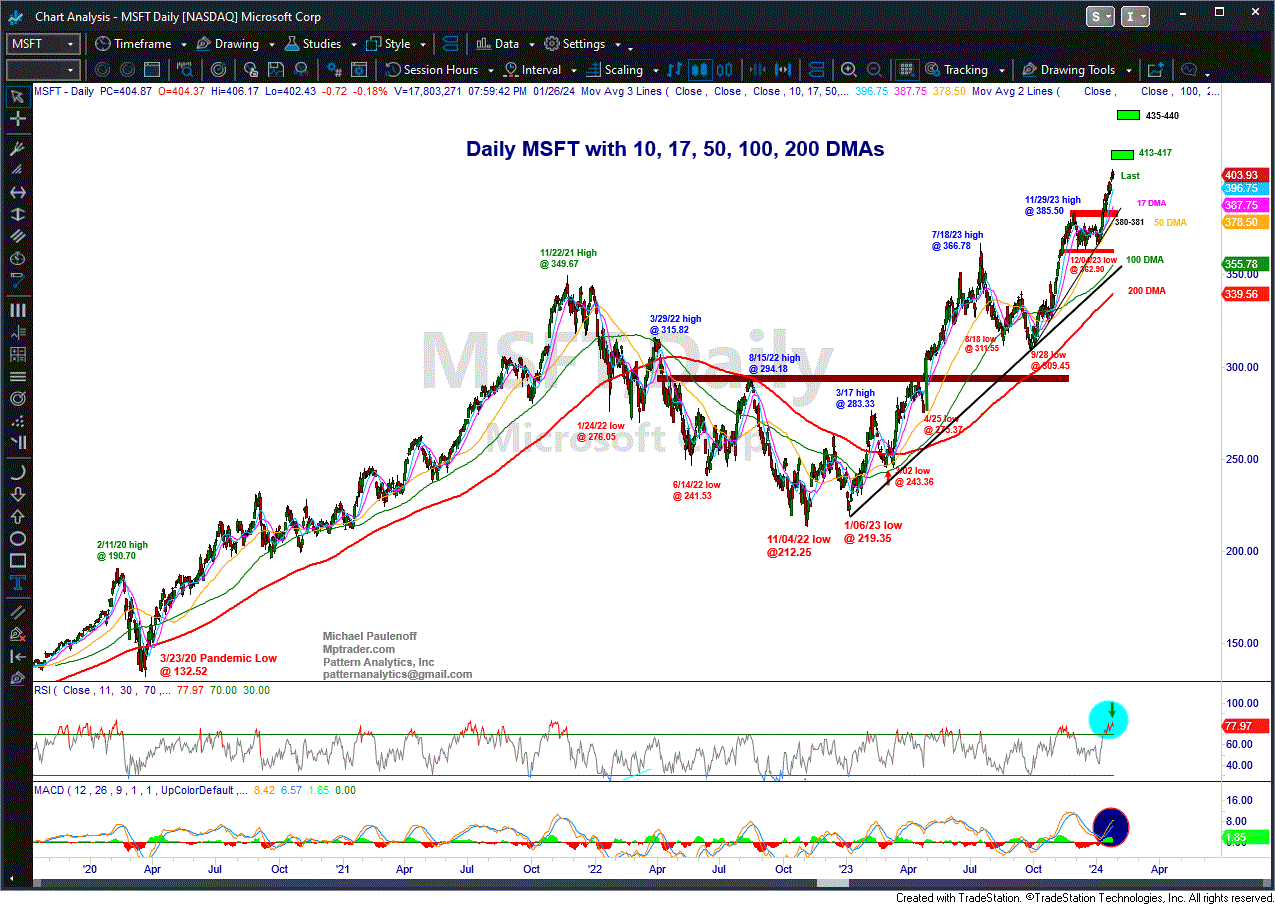
The two largest components of the cash SPX index are AAPL (7.2%) and MSFT (6.5%), also two of the Magnificent 7. In that the price direction of AAPL and MSFT has and will continue to exert a strong influence on the other names in the SPX, what, if anything, are their respective technical setups indicating about the probable directional reaction to this week’s earnings reports?
My daily chart of AAPL argues strongly that unless and until a bout of weakness (a negative reaction to earnings in particular) inflicts technical damage by pressing beneath support from 179 to 182, the dominant bull phase from the January 3rd low at 124.35 will remain intact, and, as such, a climb above 200 will trigger upside potential to 225-240 thereafter, and could create a meaningful draft for other names in the cash SPX.
TradeStation
As for MSFT, it too is in the grasp of a very powerful uptrend pattern. Only a bout of post-earnings weakness that presses the stock beneath support at 380 will inflict meaningful technical damage. Barring a breach of 380, MSFT’s currently bullish setup points still higher, into the 413-417 initial upside target (+2.2% to +3.2% from its January 26th close), and if hurdled, then toward 435-440 (+7.7% to +8.9% from its January 26th close).
TradeStation
Unless otherwise indicated, the "immovable force" (aka, A Market Top) will remain at bay for a while longer.
Smooth Sailing Barring A Fed Shift On Wednesday
Barring a shift in the Fed’s mandated Inflation or employment goalposts, the data-dependent Powell Fed has little reason either to alter its explicitly stated outlook for monetary policy expressed at the previous meeting (on December 13th) or to exhibit different “body language” at this Wednesday’s meeting.
Nonetheless, should Powell feel the need to cool the market’s jets AND should AAPL and MSFT earnings disappoint, triggering weakness that inflicts technical damage that negatively impacts the broad market, then yes, the post-October 2023 vertical advance will have smacked into, and been repelled by, forces greater than its currently depleted strength 20% above the October 2023 low.
At the moment, however, that force remains out over the horizon. My work says the market is positioned for upside continuation, and that surprises will be on the upside for a while longer.