BABA Under the Microscope
 By
Mike Paulenoff
By
Mike Paulenoff
Mptrader Out Front: Tuesday August 24th, 2021
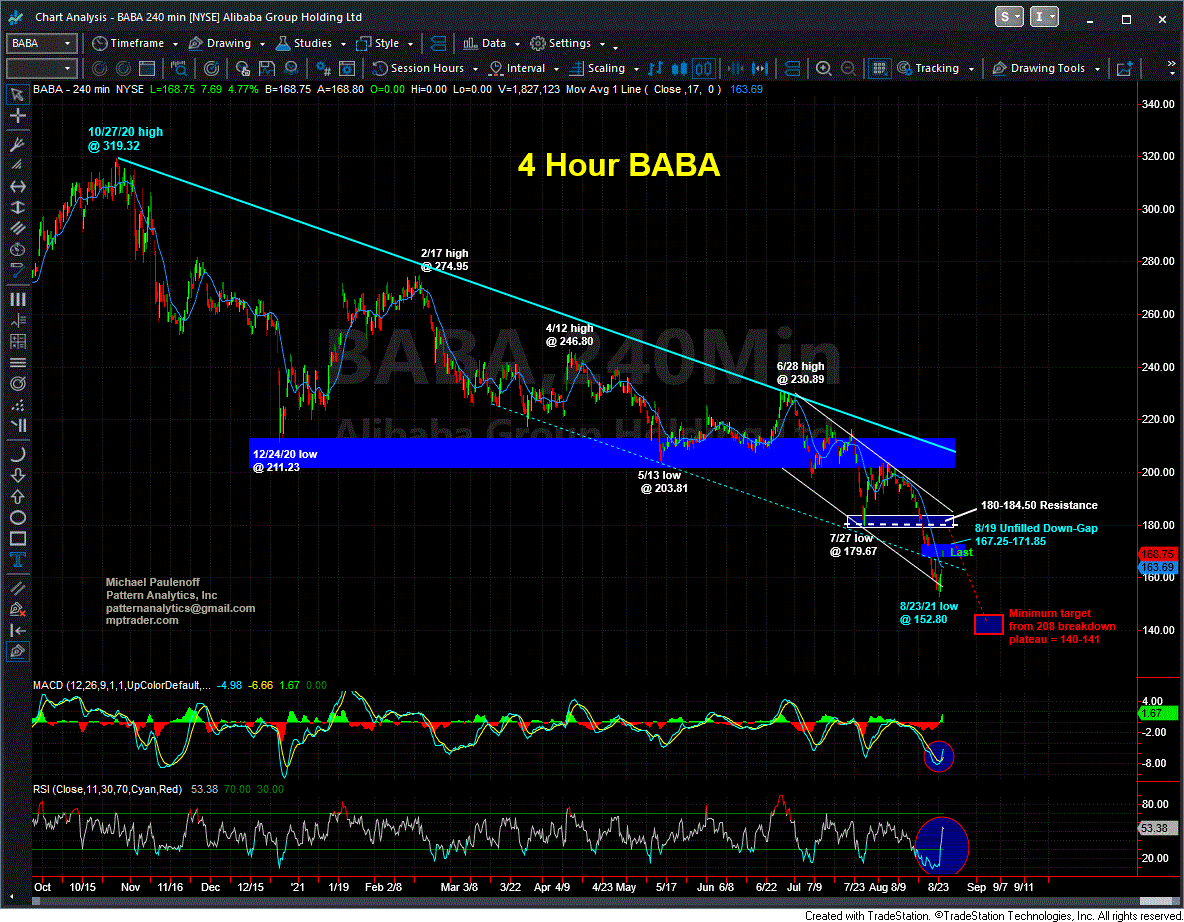
BABA is making a move higher this AM after putting in a significant near term low on Monday...
At 1 PM ET yesterday, this was our discussion about BABA:
BABA-- Yes, BABA is very oversold and could bounce violently at just about any time. In fact, as we speak, BABA has just climbed into positive territory at 158.00, off of this AM's 12 month low at 152.80. Where could BABA bounce? Although BABA needs to claw its way above 210 to make a serious dent in the dominant downtrend, from a granular nearest term perspective, as long as BABA remains above today's low at 152.80, it should be able to climb to fill the down-gap to 170.50 from 167.25 left behind last Thurs. morning. At that point, if and when it gets there, we will evaluate the form of the rally to determine if it is the start of a new, larger counter trend rally period, or a "dead cat bounce" ahead of unfinished business on the downside... Last is 158.12...
-----------------------
Fast-forward to this AM, we find BABA trading much higher, now just above 169.00, +5.3% above yest.'s close at 161.06, in reaction to an "extremely oversold condition that has developed after months of selling pressure off of BABA's ATH at 319.32 into yest.'s low at 152.80 (-52%!).
My attached 4 hour chart argues for more upside, into the remaining unfilled down-gap area from 171.85 to 1.67.25 left behind after last Thurs. (8/19) open.
The first litmus test of the staying power of the BABA rebound will be if and when the stock attempts to climb ABOVE the upper boundary of the down-gap at 172.00. If BABA can hold above the gap, then we will refocus our sights on much more significant resistance lodged from 180 to 184.50.
From my intermediate term pattern perspective, the July breakdown beneath the 8 month former support plateau from 212 to 203 separates two distinct portions of a major corrective or bear phase period. In my decades of experience analyzing patterns and charts, when an ongoing correction breaks a series of corrective prior lows spanning a multi-month timeframe, the magnitude of the decline beneath the former support plateau approximates a distance at least 60% of the downmove recorded from the high down to the support plateau.
In other words, if BABA declined from 319.32 (10/27/20 ATH) to roughly the 208 support level, or a distance of 111 points, then the projected downside target beneath 208 is at least 60% of 111, or 67 points from the breakdown level (208), which points to a 141 target at a minimum.
Unless BABA is able to claw its way above 184.50 during the developing recovery rally, my work will continue to project another bout of weakness that points to a new corrective low into the vicinity of 140.
Bottom Line: For the time being, let's treat the upmove in BABA as an oversold rally within a still-dominant bear phase, looking for a downside reversal from beneath 184.50 that reasserts the downtrend. For anyone long BABA, consider current strength a counter trend scalp opportunity until the upmove proves itself... Last is 168.94....