Big Picture Analysis of Emini S&P 500

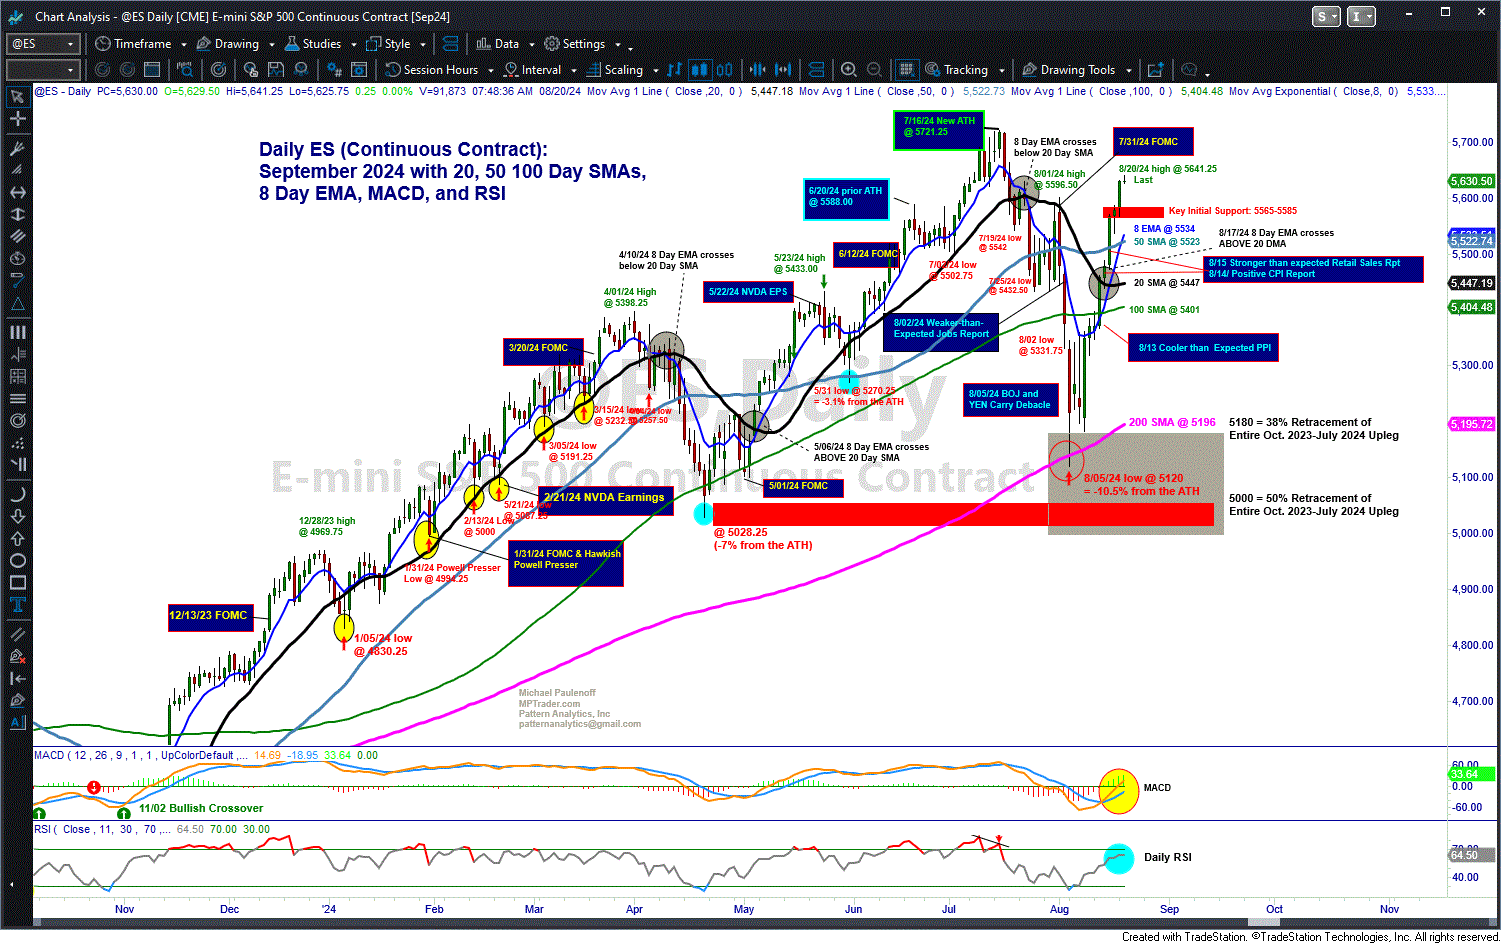
A look at my annotated Big Picture Daily Chart. The key elements are 1) Nearest Key Support at 5565 to 5585... 2) the juxtaposition of the upturning 50 DMA, now at 5523, which represents major support beneath 5565/85... and 3) the 8/17/24 positive crossover of my 8 Day EMA above the 20 Day SMA that in the past has signaled the start of a powerful intermediate-term advance (the last two weeks certainly qualifies!)...

  Matched
x
  • Action-Oriented Trade Set-Ups in Stocks & ETFs
  • Macro Analysis of the Broader Markets
  • Detailed Technical Guidance for each Trading Idea
  • Live Interaction w/ Mike & Our Member Community
  • And Much, Much More!
Join Now! - Special Offer!
Veteran Wall Street analyst and financial author, Mike provides detailed and timely analysis and trade set-ups on a range of markets. Read more...

Have Mike's “Out Front” morning analysis delivered FREE to your email inbox twice weekly!