Big Picture View of Emini S&P 500
Tuesday, September 6, 2022-- Mptrader Pre-Market Update: After the long holiday weekend, let's get our market bearings with a Big Picture View of ES (E-mini September S&P)...
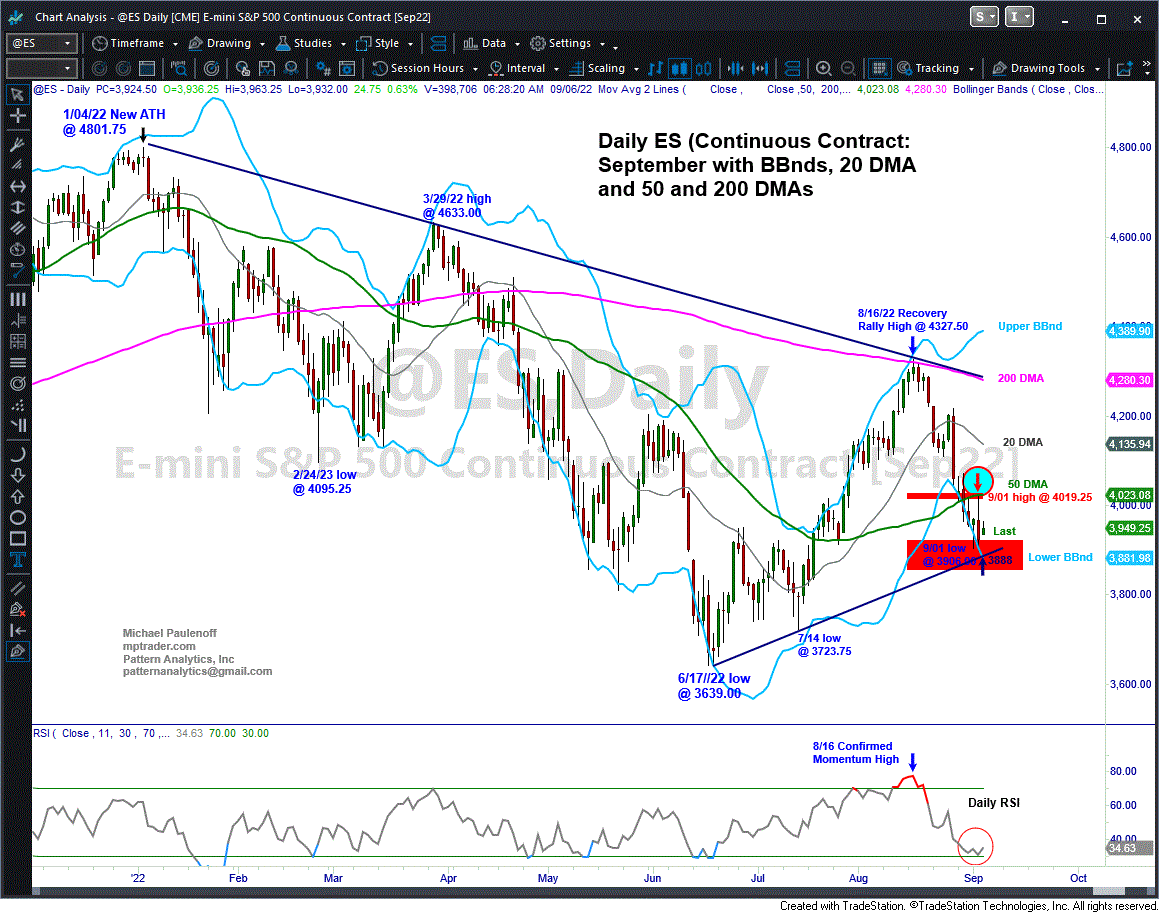
My attached Daily Chart shows all of the price action and the entire pattern from the January 2022 All-Time High (ATH) at 4801.75 through the June corrective low at 3639 (-24.2%), and beyond, into today's early pre-market session (last is 3945.50).
The most salient aspect of the pattern is the series of lower highs from the ATH at 4801.75 down to 4633 (3/29) and then to 4327.50 (8/16). Unless and until the series of lower highs is hurdled, the dominant trend remains DOWN.
Let's also notice that the down-sloping 200 DMA, now at 4280 is closely tracking the dominant down trendline created by connecting the series of lower highs off of the January ATH, which represents a powerful impediment to any forthcoming advance (should one emerge in the upcoming weeks).
From a near-term pattern perspective, the advance off of the June low at 3639 into the August recovery rally high at 4327.50 exhibits counter-trend form (distinctly different from bullish form), and as such my preferred scenario argues that all of the action off of the June low is a "time-killing" operation (aka a Bearish Digestion Period within a dominant downtrend) ahead of downside continuation WHEN the time-killing operation runs its course.
That said, however, my nearest-term pattern and momentum work, indicate that as long as the June-September support line (see Chart) that cuts across the price axis in the vicinity of 3888 today contains any forthcoming weakness, the ES setup suggests strongly that another loop to the upside into the 4100-4140 area is more likely than a breakdown towards a retest of the June-July low-zone from 3639 to 3725.
Should such a near-term positive scenario play out in the upcoming hours and days, ES must hurdle and sustain above last Thursday's (9/01) rally high at 4019.25 to gain important and potent bullish traction for continuation to the 4100-4140 target zone... Last is 3950.50

