Bottoming Levels To Watch For ES, TSLA
Good Thursday morning, MPTraders! April 3, 2025-- Pre-Market Update: The fallout from the forthcoming imposition of Trump's Tariff Plan has everyone EITHER confused OR whining (more about this later this AM).
As expected, the conversation this morning around the globe will be about the negative impact of the tariffs on markets. I will share my thoughts after we examine some snapshots of the carnage...
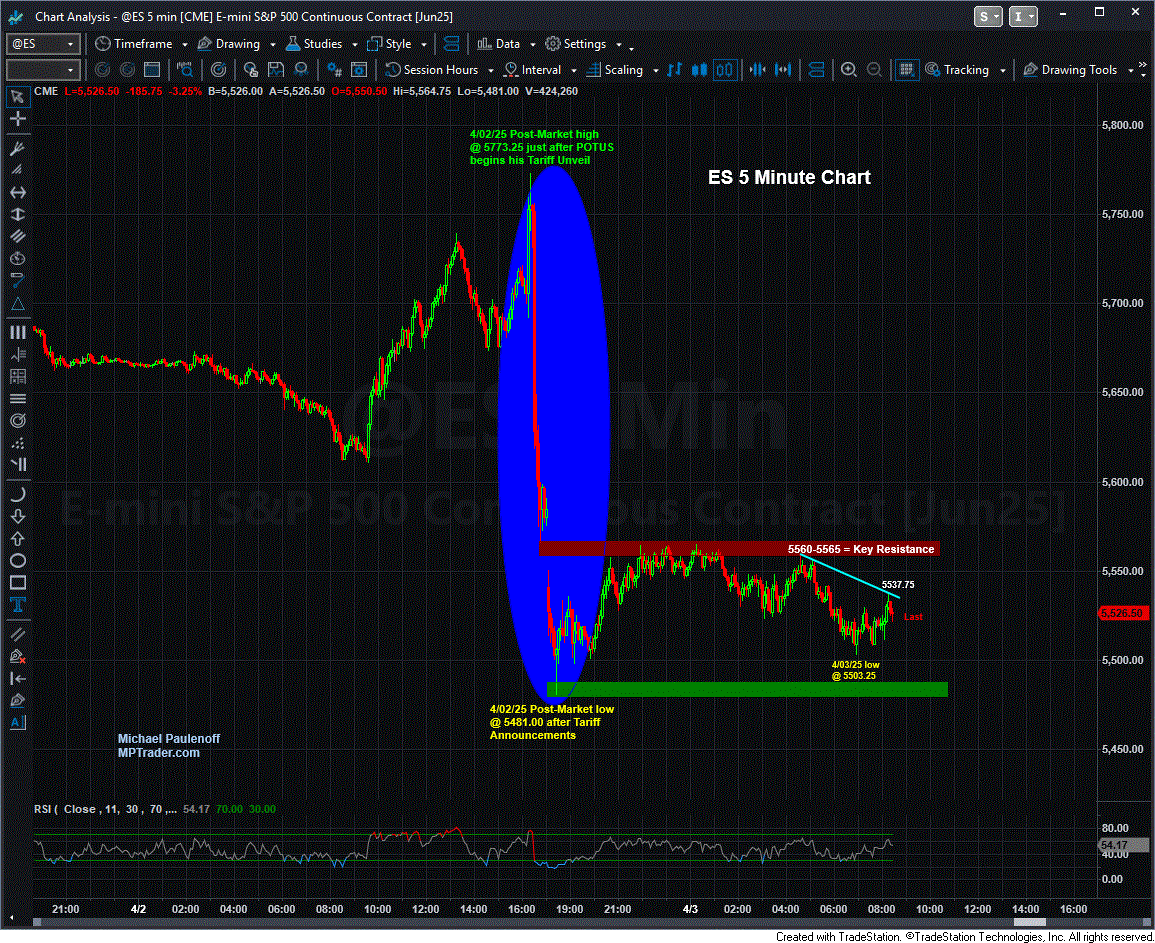
First up, my 5 Minute ES Chart, which is circling 5507 now, and is 35 points below where it was trading when Secretary Lutnick started his CNBC interview, suggesting that Mr. Market is still registering a lack of confidence in the efficacy of both the tariff policies and the administrators of the policies... (continued below the 5 Min Chart)... Last is 5496.00...
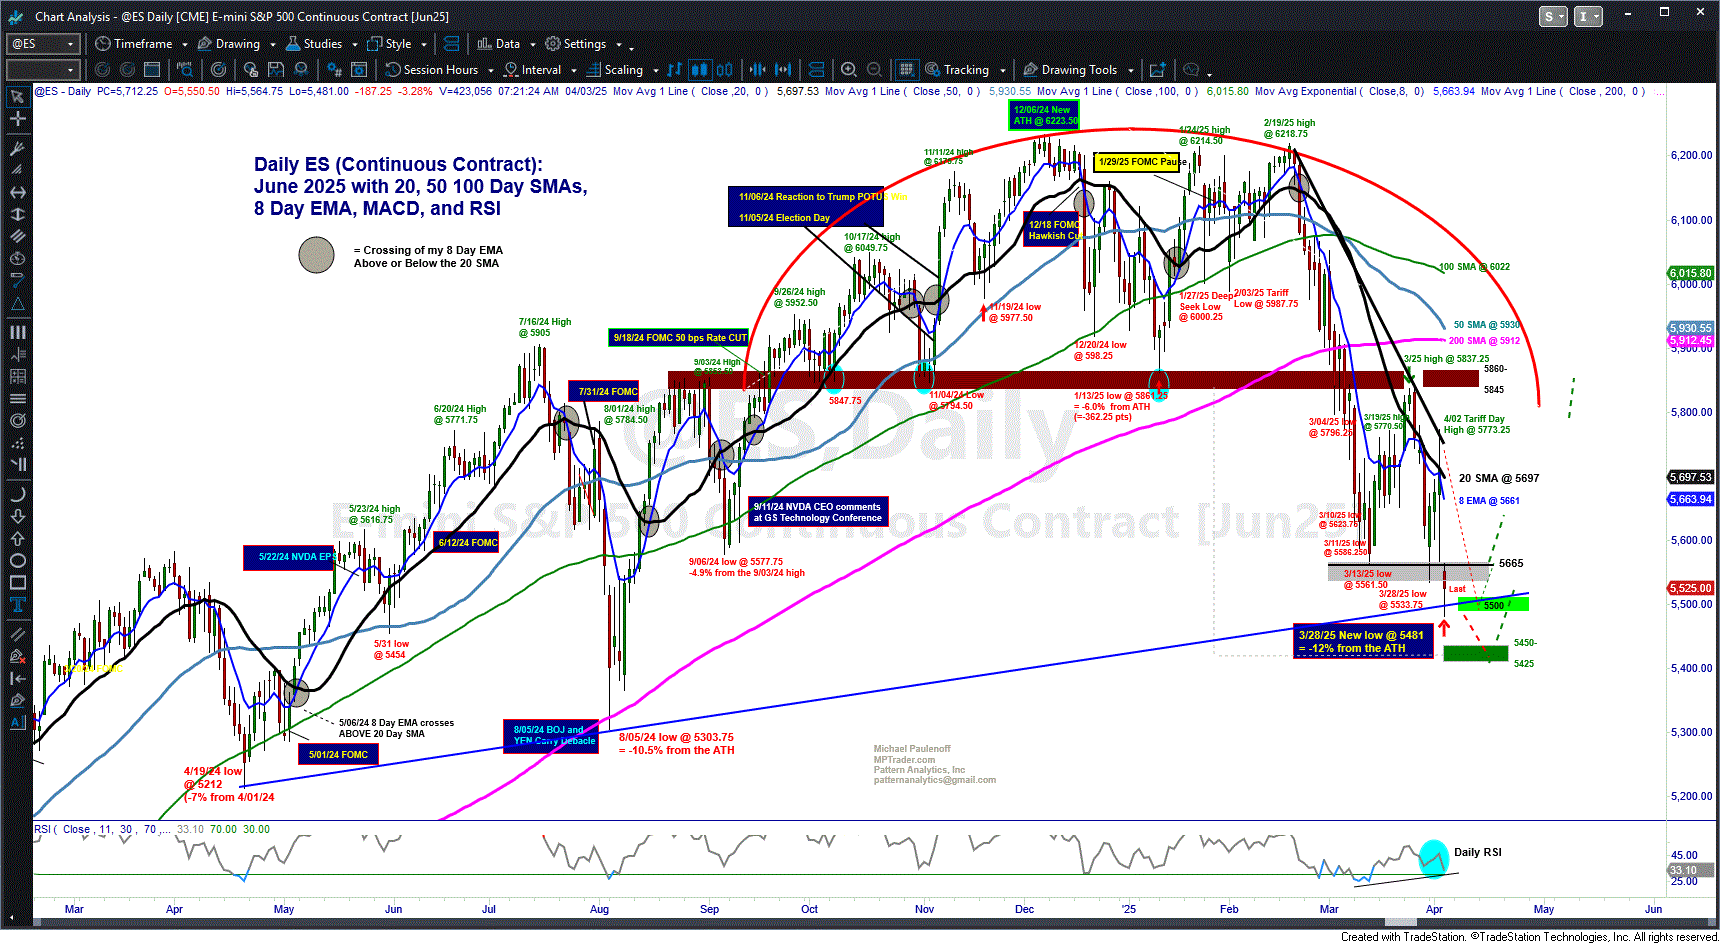
Second, my Big Picture Daily Chart shows that in reaction to the tariff announcement, ES plunged to a new corrective low at 5481, which satisfies my next lower target window of 5490 to 5500, but not yet my 5425-5450 target. To regain nearest-term upside traction, ES needs to climb and sustain above 5565 for starters. Unless that happens, ES will remain vulnerable to a press into the 5425-5450 next lower target window...
Let's notice that the 5481 low was NOT CONFIRMED by Daily Momentum, which usually coincides with a period of downside exhaustion that produces a tradable bottom. Let's consider 5481 the FIRST COORDINATE of a BOTTOMING PERIOD... (continued below the Daily Chart)... Last is 5496.00...
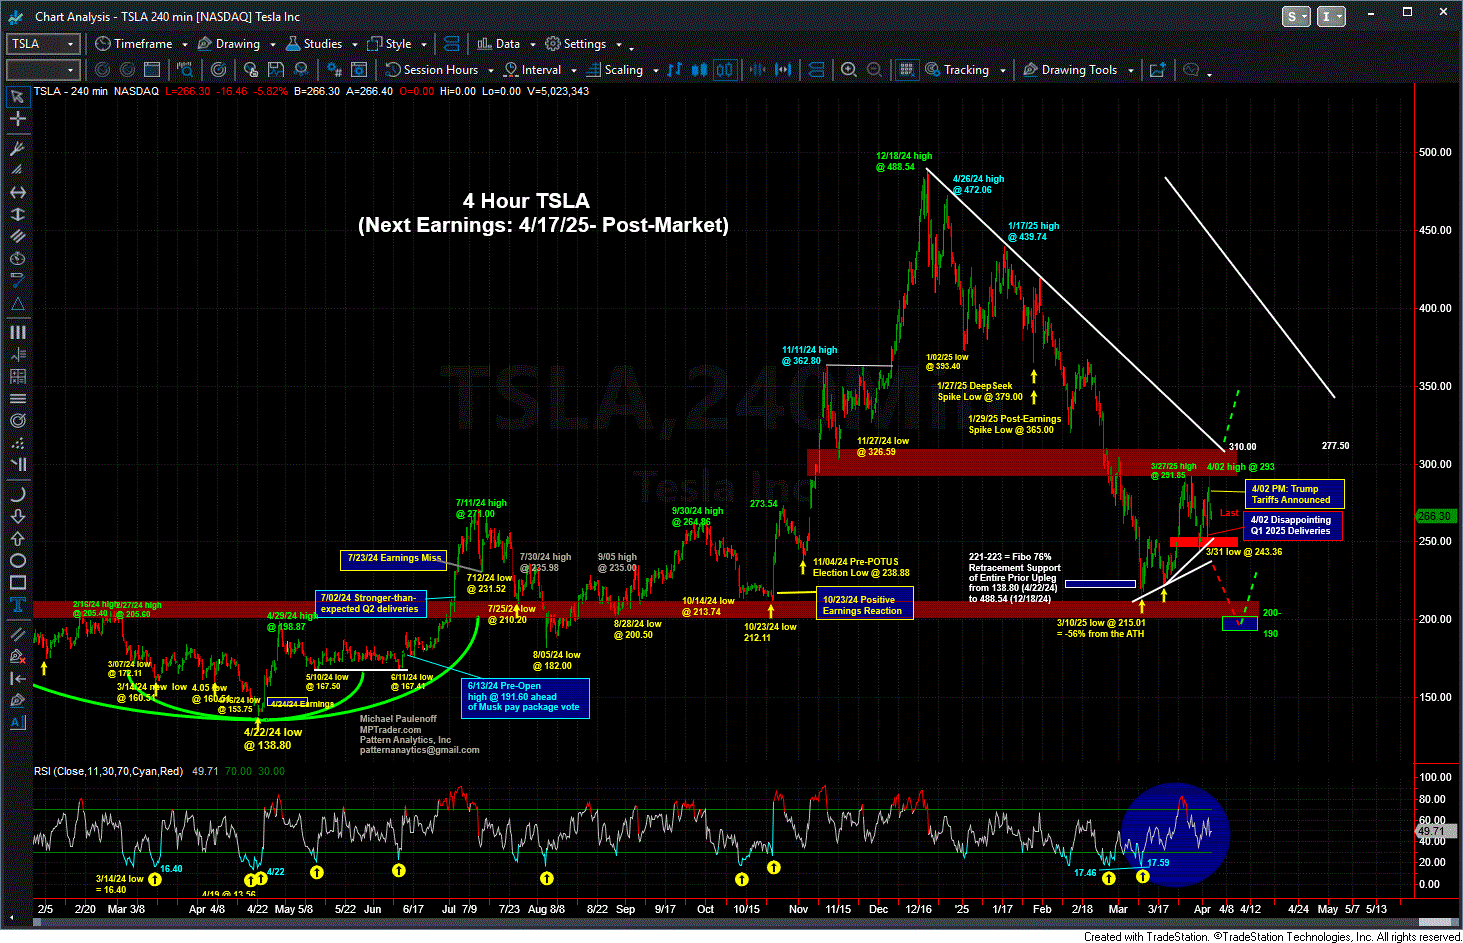
Third, I am keeping a close watch on TSLA now for two reasons: 1) Where the is smoke there is probably fire: Musk will refocus on running TSLA in the weeks ahead... and 2) In his CNBC interview, Commerce Secretary Lutnick told us point-blank that robots and robotics will play a significant role in the future of American labor and manufacturing. TSLA's Optimus Robot is at the forefront of this new business. While TSLA is known for its EVs, a massive future revenue stream could come from robots.
Technically, although TSLA is down 6% at 265 this AM, it is trading 23% above its 3/10/25 multi-month corrective low at 215.01. As long as any forthcoming weakness is contained above 243.30, my pattern work cannot rule out another run at its recent rally highs at 291.85 (3/27/25) and 293.00 (4/02/25), which if hurdled, will argue for a challenge of much more consequential down trendline resistance in the vicinity of 310 (where all of the price action off of the March low will look increasingly like a significant corrective bottom)... Last is 264.51


