Bulls Skating on Thin Ice
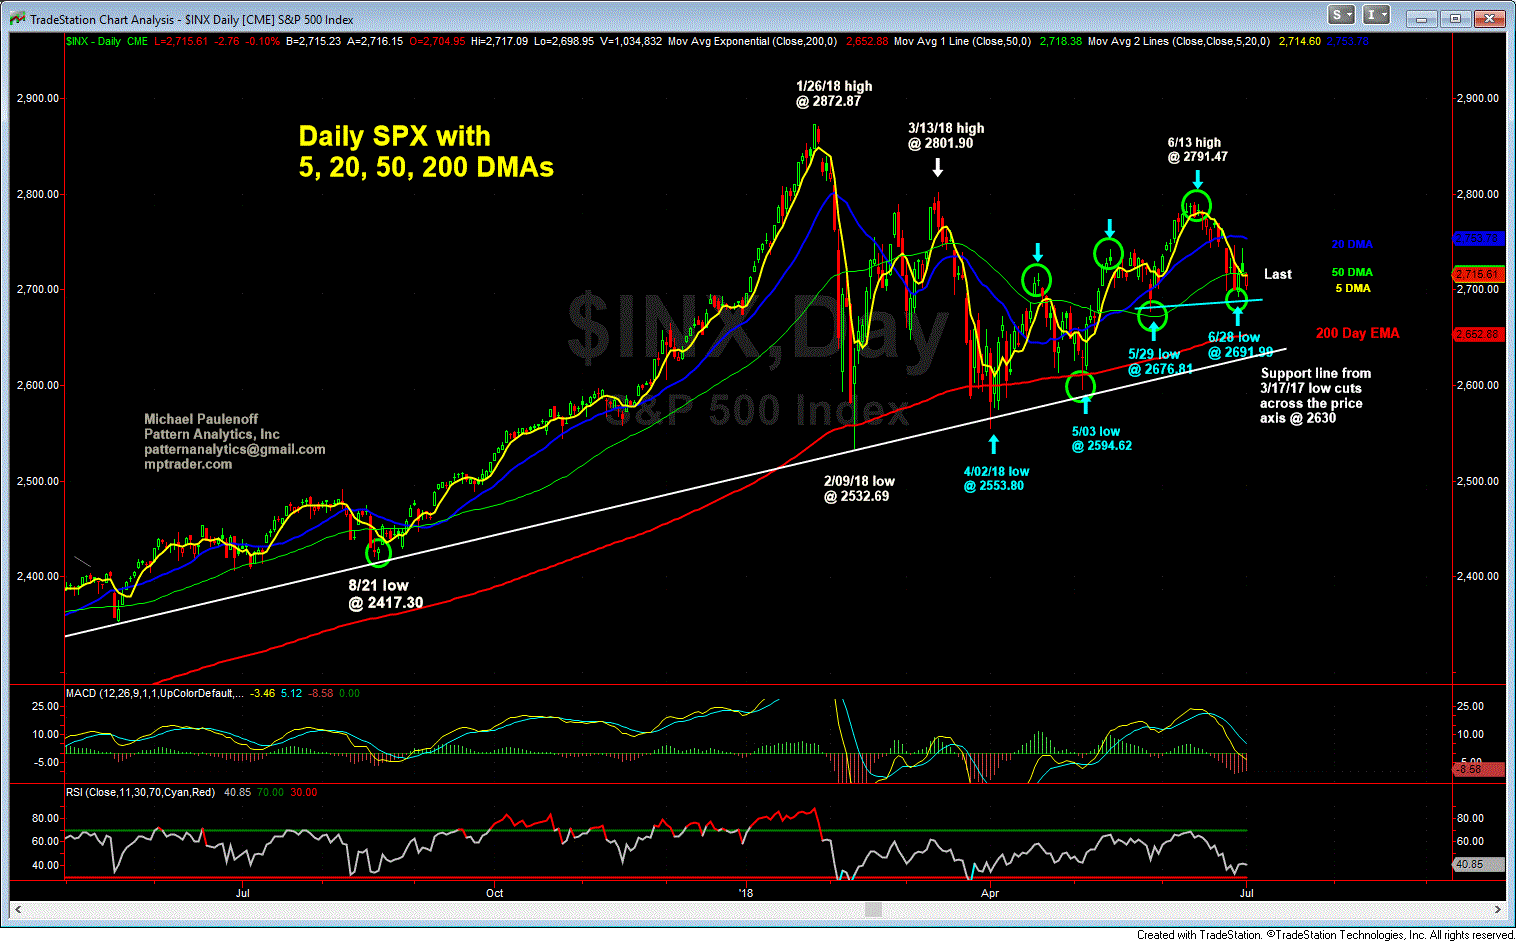
My BIG Picture chart view of the Cash SPX shows the messy, sideways pattern that has been carved out off of the Jan. 2018 high at 2872.87, which certainly looks like a digestion period in the aftermath of the powerful upleg from the 8/21/17 low at 2417.30 to the 1/26/18 high at 2872.87 (+19%).
Within the 6 month, 2018 digestion period, let's notice that all of the action off of the 4/02/18 low at 2553.80 represents a uptrend-- a series of higher-highs and higher-lows that remains the dominant feature of the last three months of trading. With the foregoing in mind, as long as the series of higher-lows remains intact at 2691.99 (6/28/18), from a strict technical perspective, the bulls will be in directional control.
However, a break of 2691.99 will at the very least neutralize the post-April uptrend, if not morph the 2018 pattern into a potential top.
In other words, the bulls are in control, but are skating on thin ice at the moment. Perhaps reaction to the upcoming earnings season (beginning at the latter portion of the week of July 9-13) EITHER will result in the resumption of strength, OR disappointment that reverses market polarity... Last is 2720.50... MJP

