CAT in "Healthy Overbought" Pattern
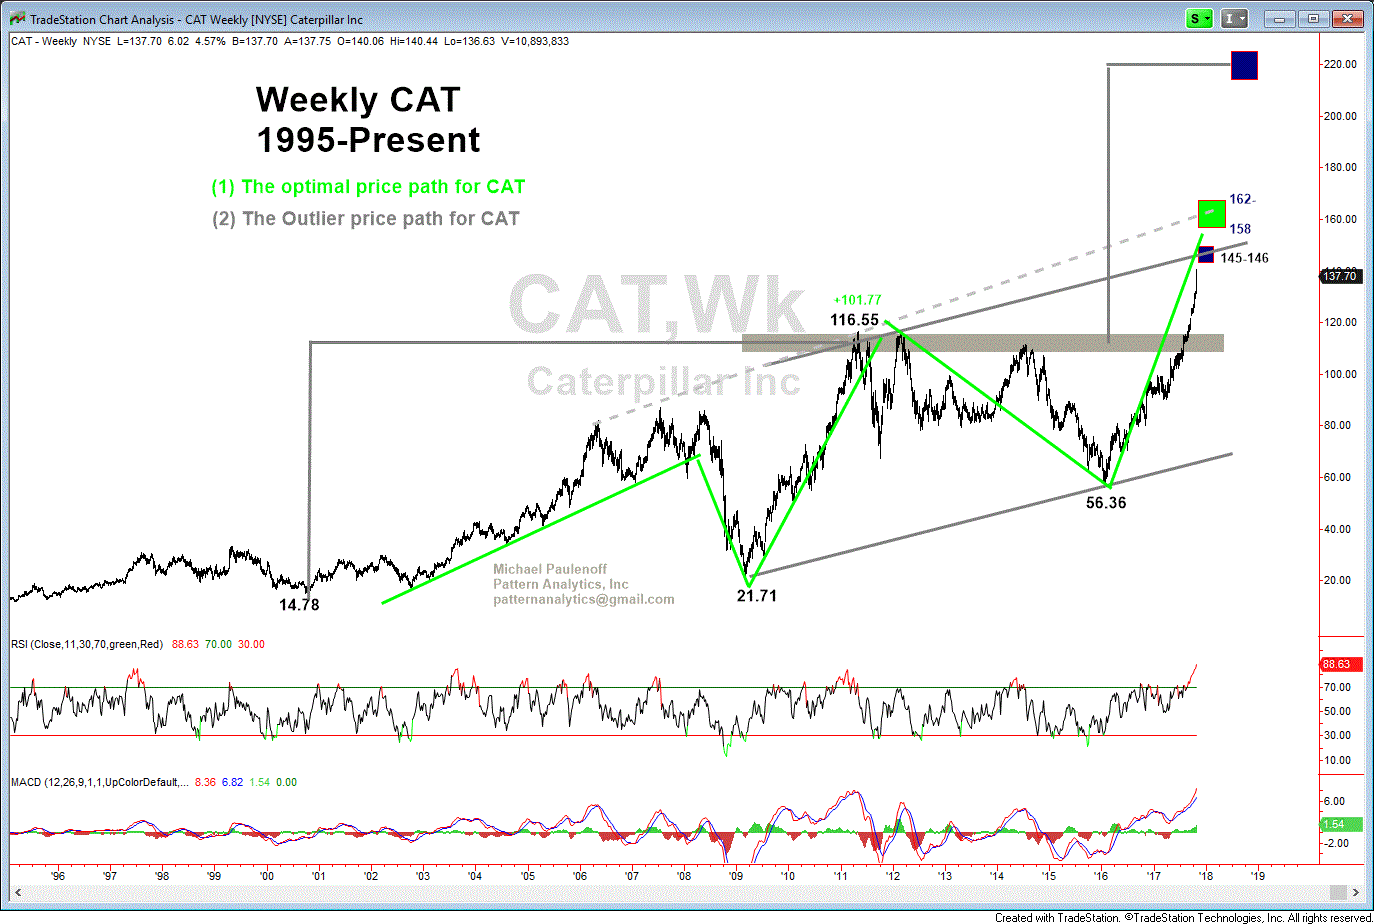
That attached long term weekly chart of CAT (1995-Present) shows my two scenarios for the stock's price path into the culmination of the powerful advance off of the pre-election pivot low at 56.36 into today's earnings-inspired high at 140.44.
The light green lines demarcate the optimal path to a target zone of 158-162, with some resistance lodged at 145-146, implying additional potential upside of 16% from current levels around 138.00.
The grey lines represent the "CAT-on-roids" scenario, which argues that when the current advance hurdled and sustained above 116.55, it triggered a measured upside objective that projects into the 210-220 target zone prior to completion, a scenario that implies anticipation of a booming domestic and global economic period directly ahead, that will be further fueled by growing expectations of tax cuts and possible tax reform. This scenario implies that CAT has 50% more upside from current levels in a blow-off, panic bull market run.
Let's notice that CAT Momentum gauges RSI and MACD are meaningfully overbought, BUT also confirm the new highs, which means we should label the gauges as "healthy overbought," rather than exhaustively overbought. The former indicates continued strength within the overbought condition, while the latter implies a trend that is decelerating.

