Can SPY Break Out & Give FB Stay of Execution?
I leave you with three fascinating big picture charts this evening:
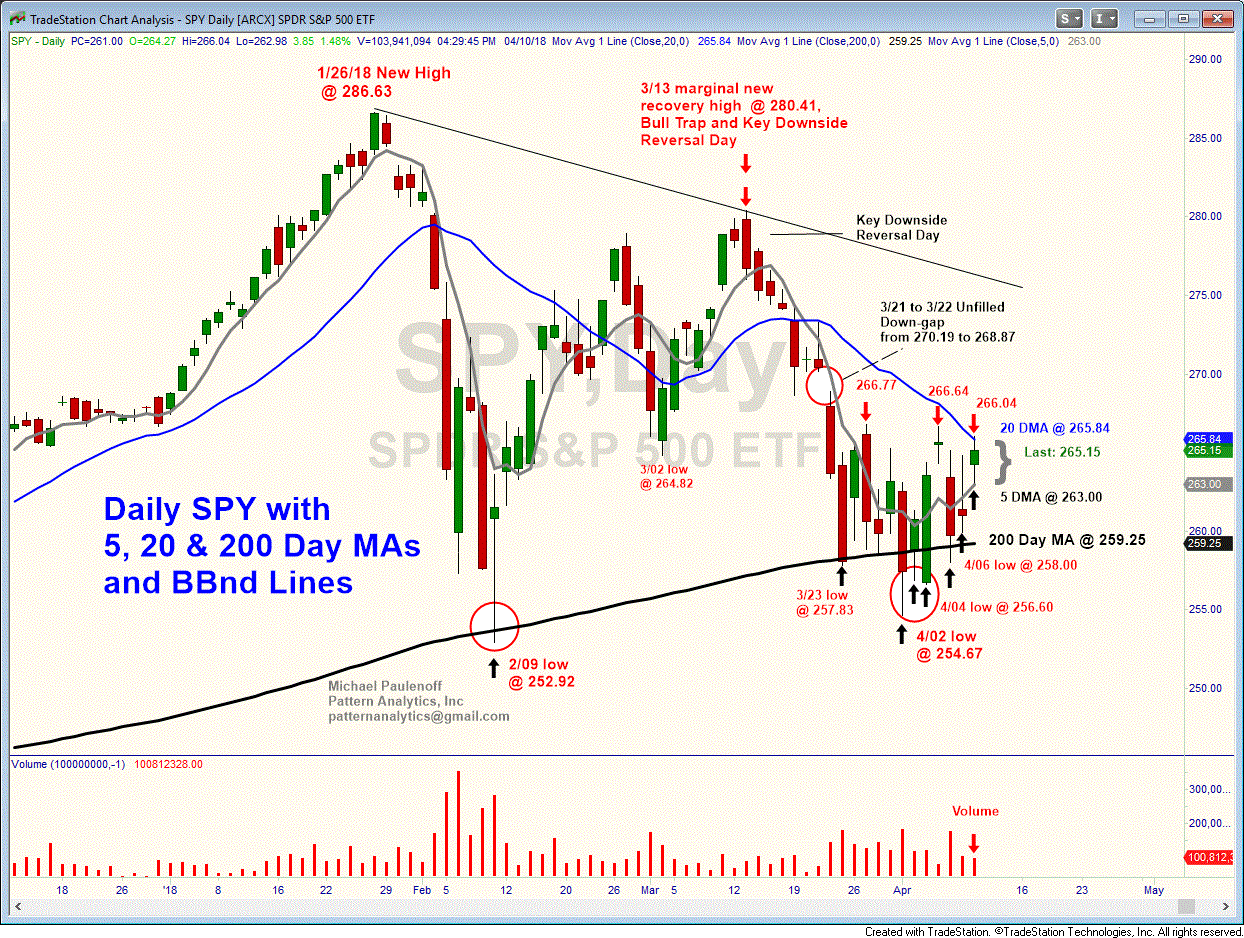
1) SPY, which in particular shows all of the action since late March, including multiple lows in the 257.80 to 254.70 range that preserved the 200 DMA (during early April) in the vicinity of 258.00, now at 259.25. Since that so far failed attempt by the bears to decisively break the 200 DMA, SPY has carved out a series of higher-lows followed by rallies that are putting intensifying upward pressure on the 266-267.15 resistance zone, which if hurdled and sustained, will be positioned to trigger powerful upside potential that projects to 270-271 quickly, in route to 274-276 thereafter. At this juncture, only a decline that breaks and sustains beneath today's low at 262.98 will compromise the bottoming effort since late March, and will point the price structure towards a downside gap-filling expedition, seeking to fill this week's Monday and Tuesday unfilled up-gaps.
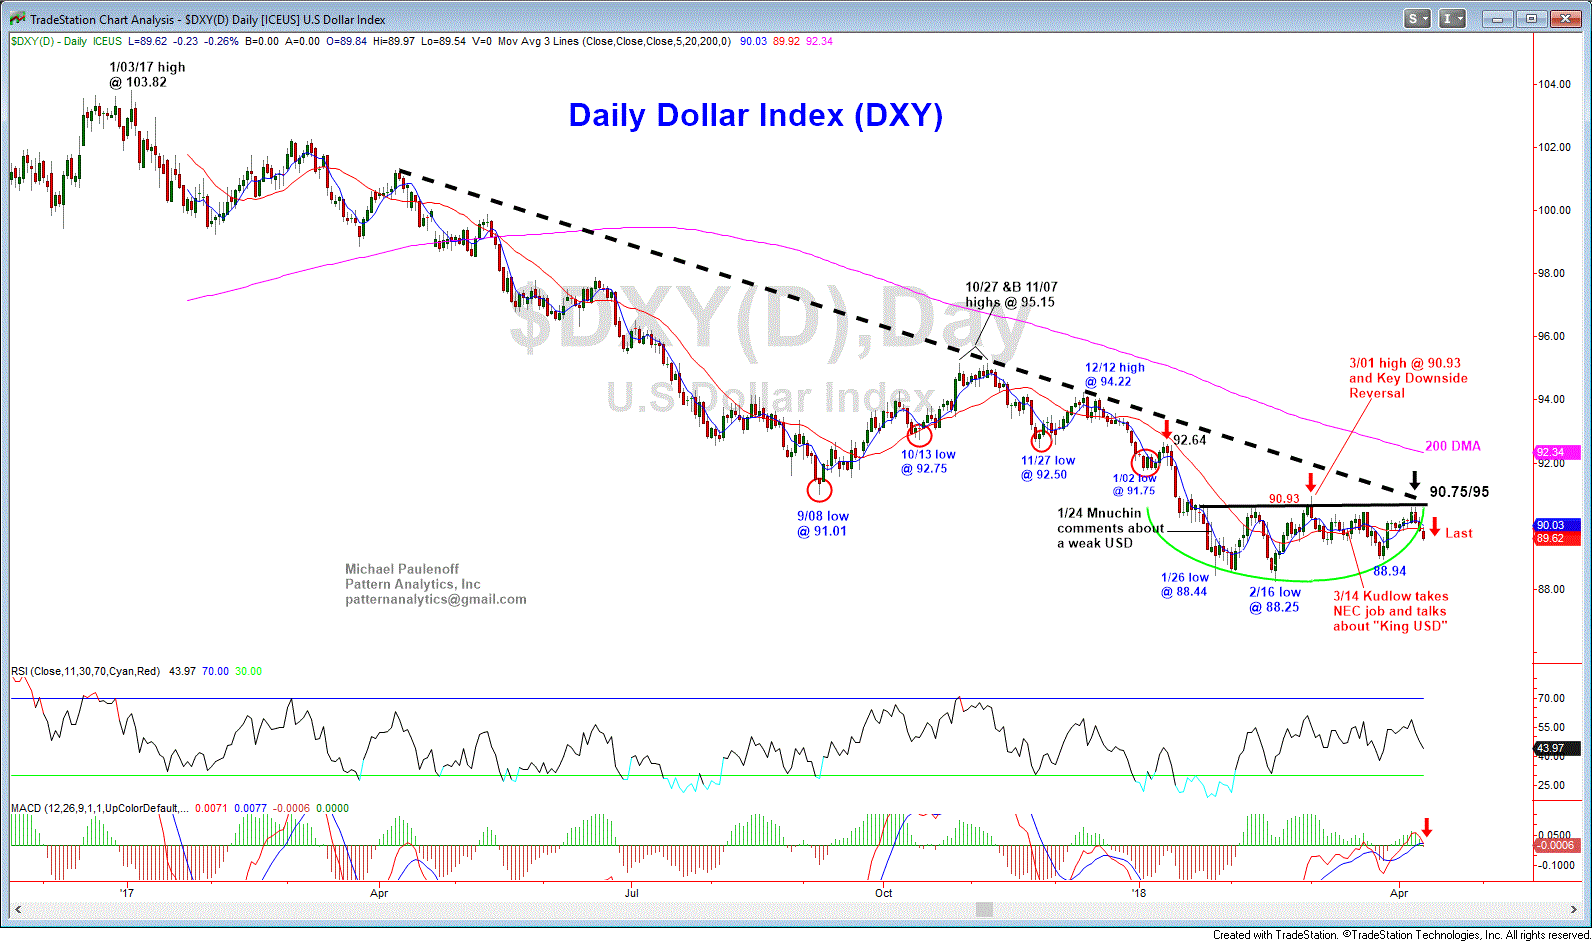
2) DXY-- easily the most mysterious chart set up on the board, because last Thursday and Friday, DXY strength looked like it was going to thrust above key near and intermediate term support at 90.90 to 91.00, completing a Jan. - April base-like pattern that would trigger upside potential to 94.00/40 thereafter. Curiously, DXY failed to break out to the upside, and instead, pivoted to the downside to 89.65 today, putting the 2-1/2 month base pattern in jeopardy, and pointing DXY towards the initiation of a new downleg that extends the dominant Dollar bear market that originated at the Jan.2017 high at 103.82.
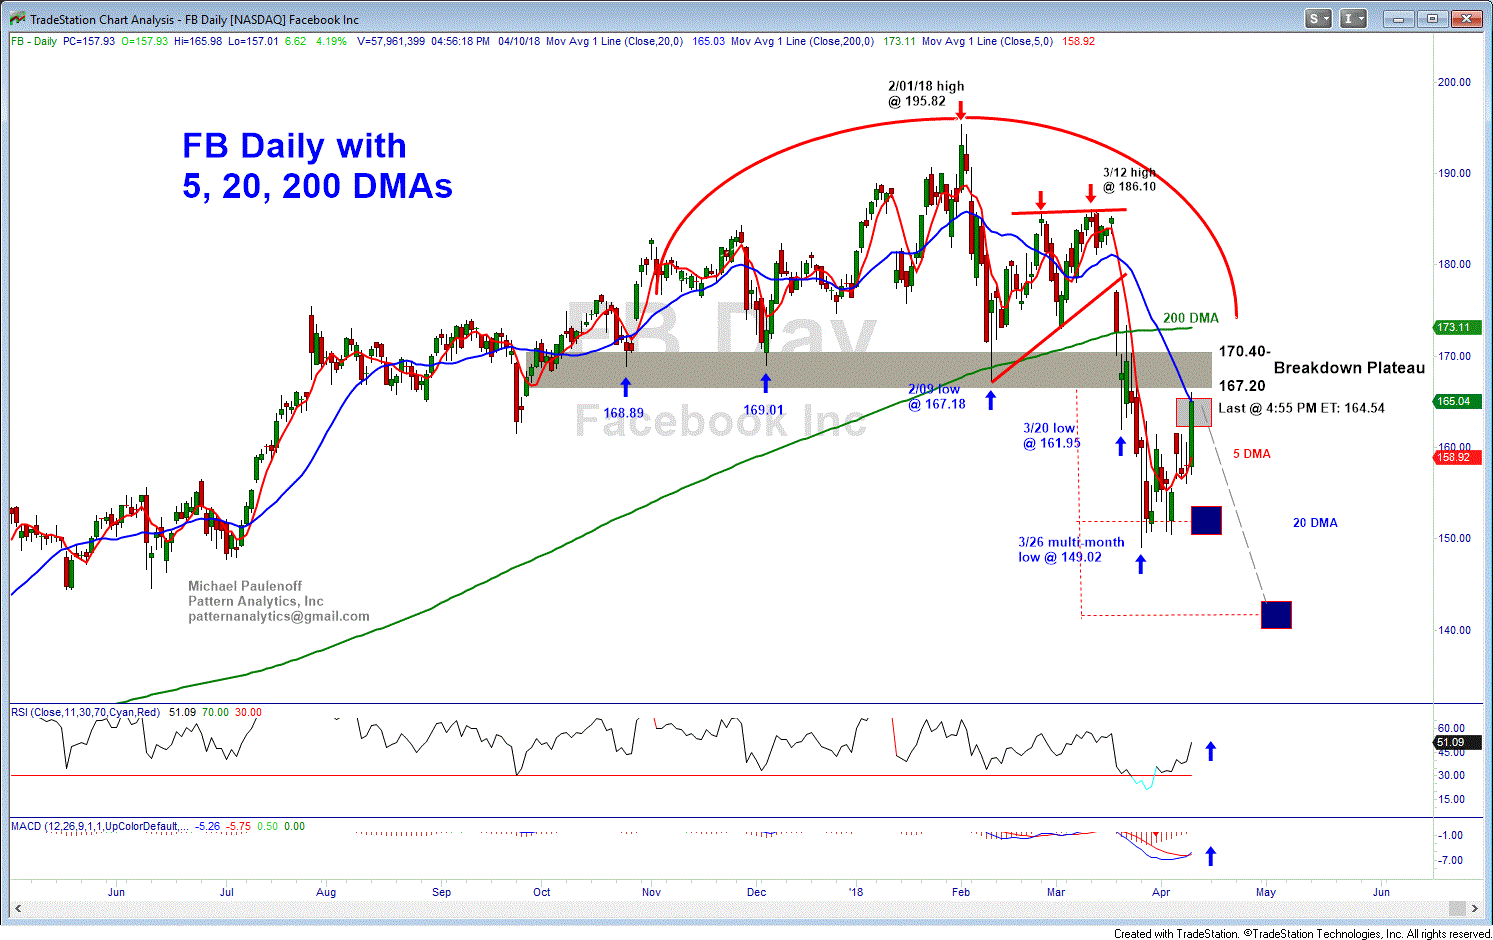
3) FB-- curiously (to me), was bid from the moment, CEO Mark Zuckerberg started reading his prepared remarks before Member of the Senate this afternoon. FB was trading around 163.70 when the hearing began, and right now, as the hearing nears the end of day one, is trading at 165.60, which we see on the attached daily chart, has smacked into its sharply down-sloping 20 DMA (165.03), and is nearing a confrontation with multi-month resistance at 167.20 to 170.40. Based on the intermediate term top formation, FB should peak in the upcoming hours, reverse to the downside into another downleg that will point to 140-142.
If SPY fails to take out its resistance at 265.00-267.00, and turns down, FB will lead Nasdaq lower. If SPY breaks out to the upside, the FB will get a stay of execution, and likely head towards filling the gap left behind on 3/19/18 above 177,
Tomorrow, Zuckerberg will testify before Members of the House of Representatives.
Have a great evening everyone. Let's see what tomorrow brings. MJP


