Chart Setups (ES, VIX, TLT, NVDA) Ahead of Fed Minutes
Good Wednesday Morning, MPTraders! February 21, 2024-- Pre-Market Update: Today is all about the Fed Minutes from the 1/31/24 meeting (2 PM ET), NVDA Earnings after the close, as well as a few notable Oil company quarterly results as well (see Earnings Calendar below)...
Let's review some relevant chart setups ahead of The Minutes (2 PM ET), which represents the next macroeconomic directional market catalyst...
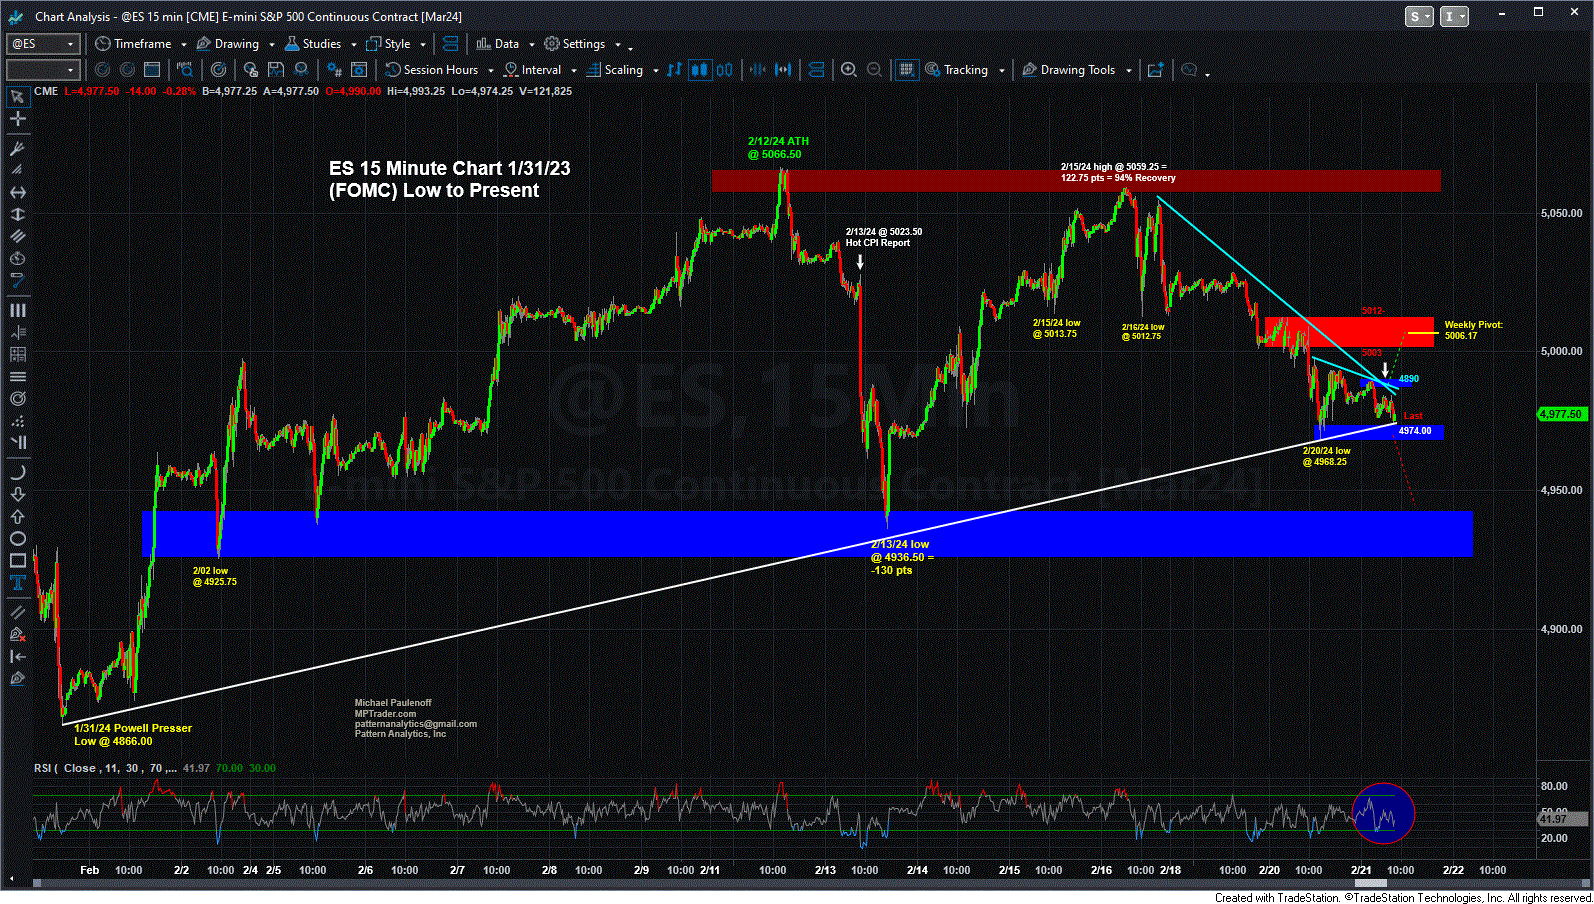
ES from a near-term perspective is circling and dancing on a significant support line off of the 1/31/24 (Fed Meeting) low that cuts across the price axis in the vicinity of 4974 this AM, and which if violated, will argue for a retest of yest.'s low at 4968.25. A sustained breach of yest's low will point ES toward 4935/40. Conversely, to regain intraday upside traction, ES needs to climb and sustain above 4989/90... last is 4974.00...
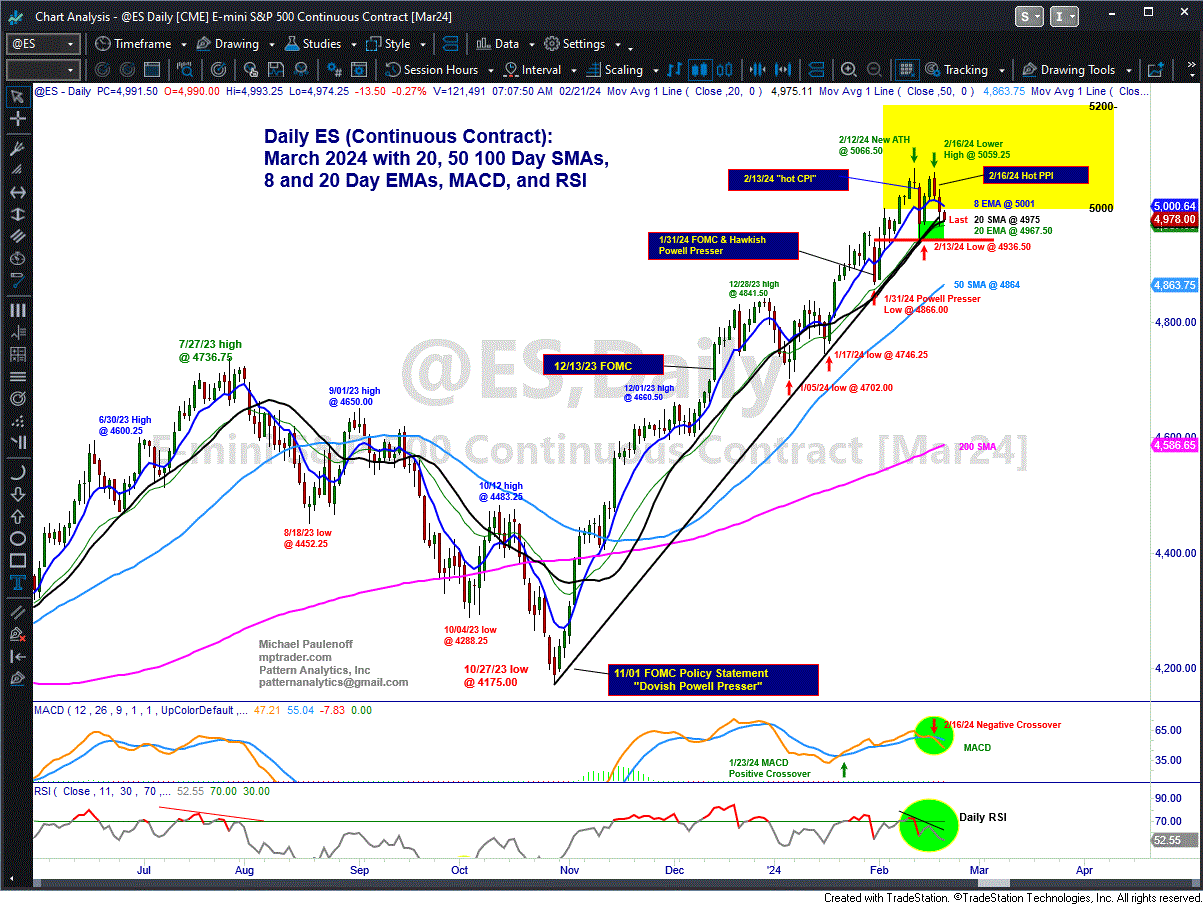
Juxtaposed against my Big Picture chart setup in ES, a break below BOTH 4974 and 4968.25 levels (mentioned above) also will put intense pressure on the rising Simple and Exponential 20 DMAs which have provided technical support for every pullback off of the October low, and especially since the 1/05/24 low (see my attached Daily chart), and as such, a sustained violation of the MAs will leave ES vulnerable to downside continuation...
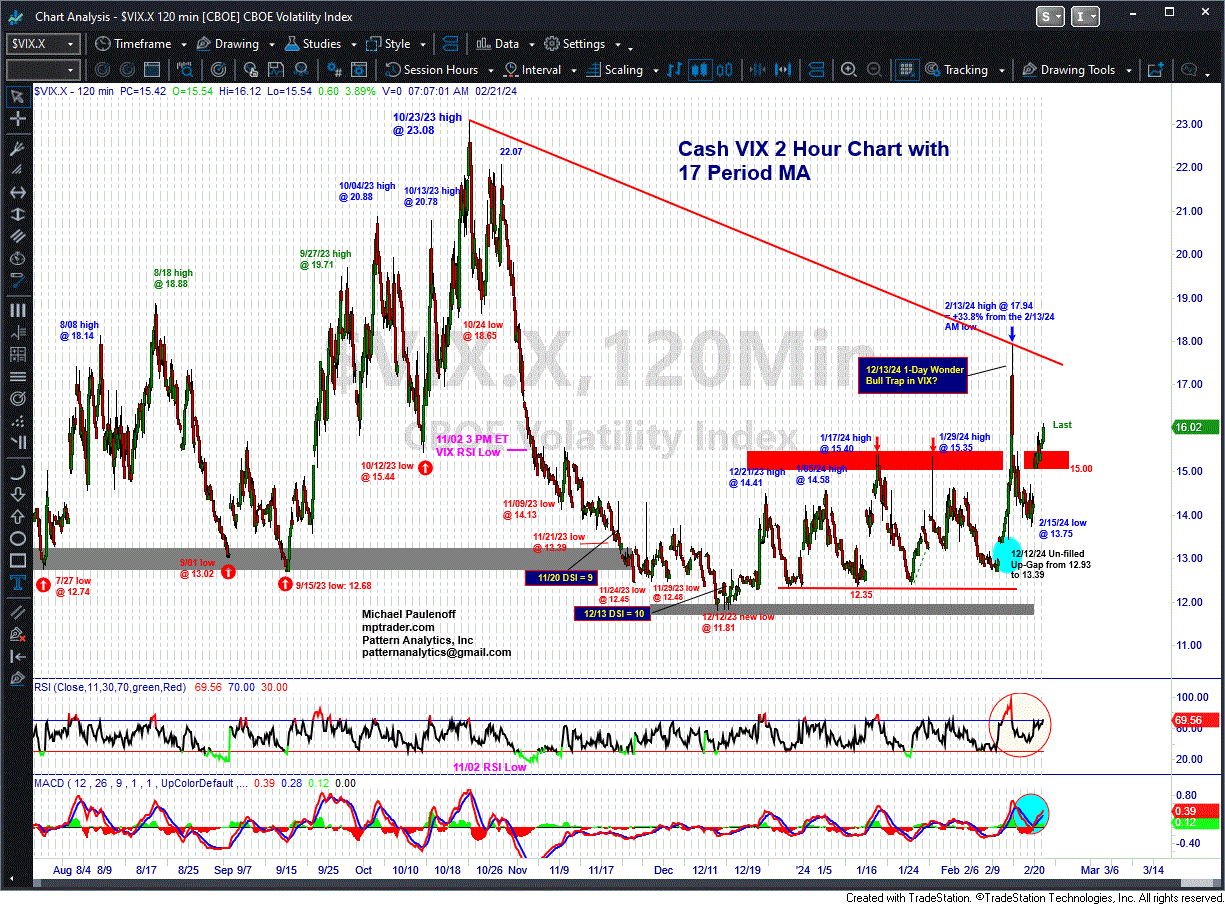
Meanwhile, Cash VIX is on the move higher toward a potential retest of last week's high zone from 17 to 18. As long as VIX remains above 15 my pattern work considers it a near-term warning signal for weakness in the SPX (ES, SPY)... Last is 16.01...
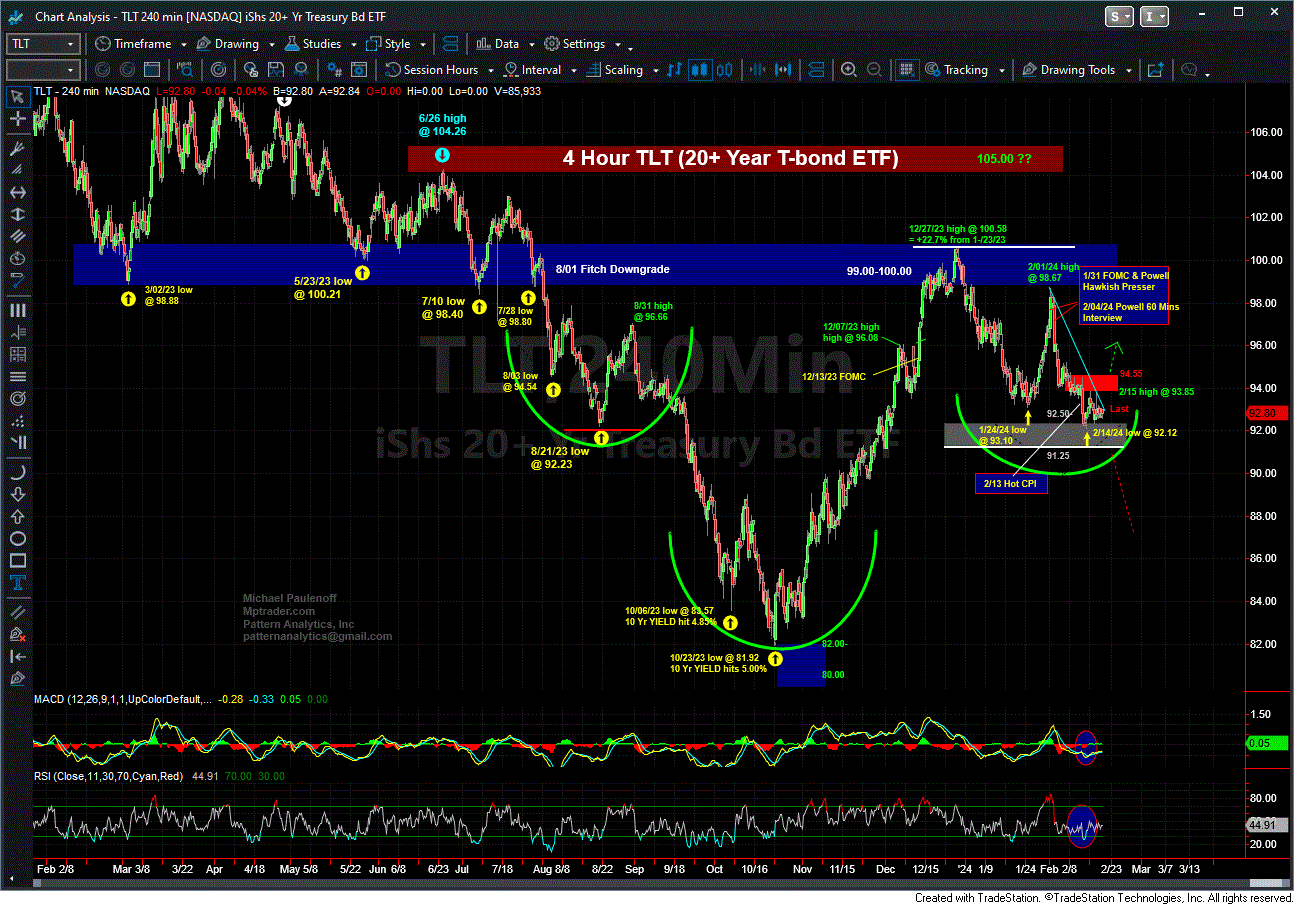
The TLT (20+ Year T-bond ETF) will react one way or the other to whatever The Fed Minutes say or imply, and to the knee-jerk algo spikes immediately thereafter. As of this moment, TLT remains in the grasp of its Jan-Feb correction off of the 12/27/23 high at 100.58 into last week's (2/14/24) low at 92.12. The inability of TLT to climb into and above key nearest resistance from 93.85 to 94.55 leaves it vulnerable to lower-lows into my "line-in-the-sand" support level at 91.25 that must contain renewed selling pressure to avert a press toward 85-86 thereafter-- and a surge in longer-term rates (10 year YIELD) toward 4.50%+... Last in TLT is 92.67
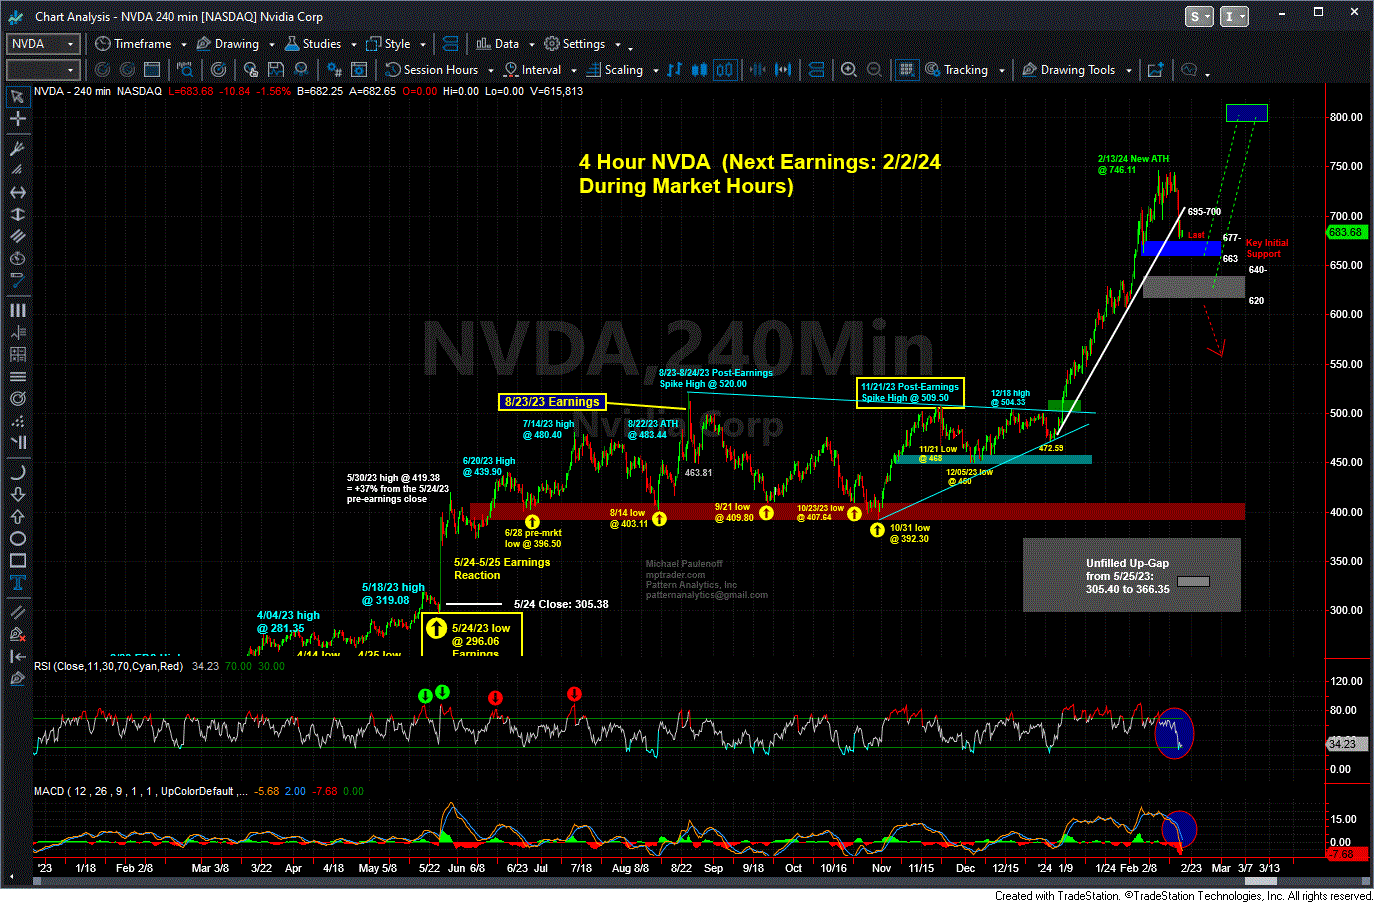
NVDA from the perspective of my 4-Hour chart setup is almost self-explanatory from my overlaid annotations and dotted projections... Last is 681.40...

