Chart on Emini S&P 500: Directional Market Catalyst Lurking?
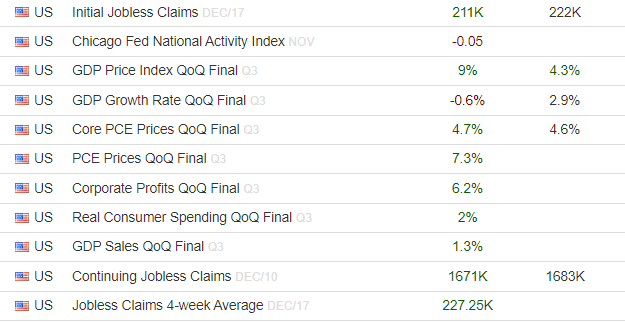
Thursday, December 22, 2022-- Mptrader Pre-Market Update: Is there a directional market catalyst lurking on the list of economic data due for release at 8:30 AM ET? We shall soon find out, but if I am guessing, it will be in the Weekly Jobless Claims data, which "one of these days" is going to show a jump in unemployment claims that will confirm a softening labor market amid a sluggish (recessionary) economy.
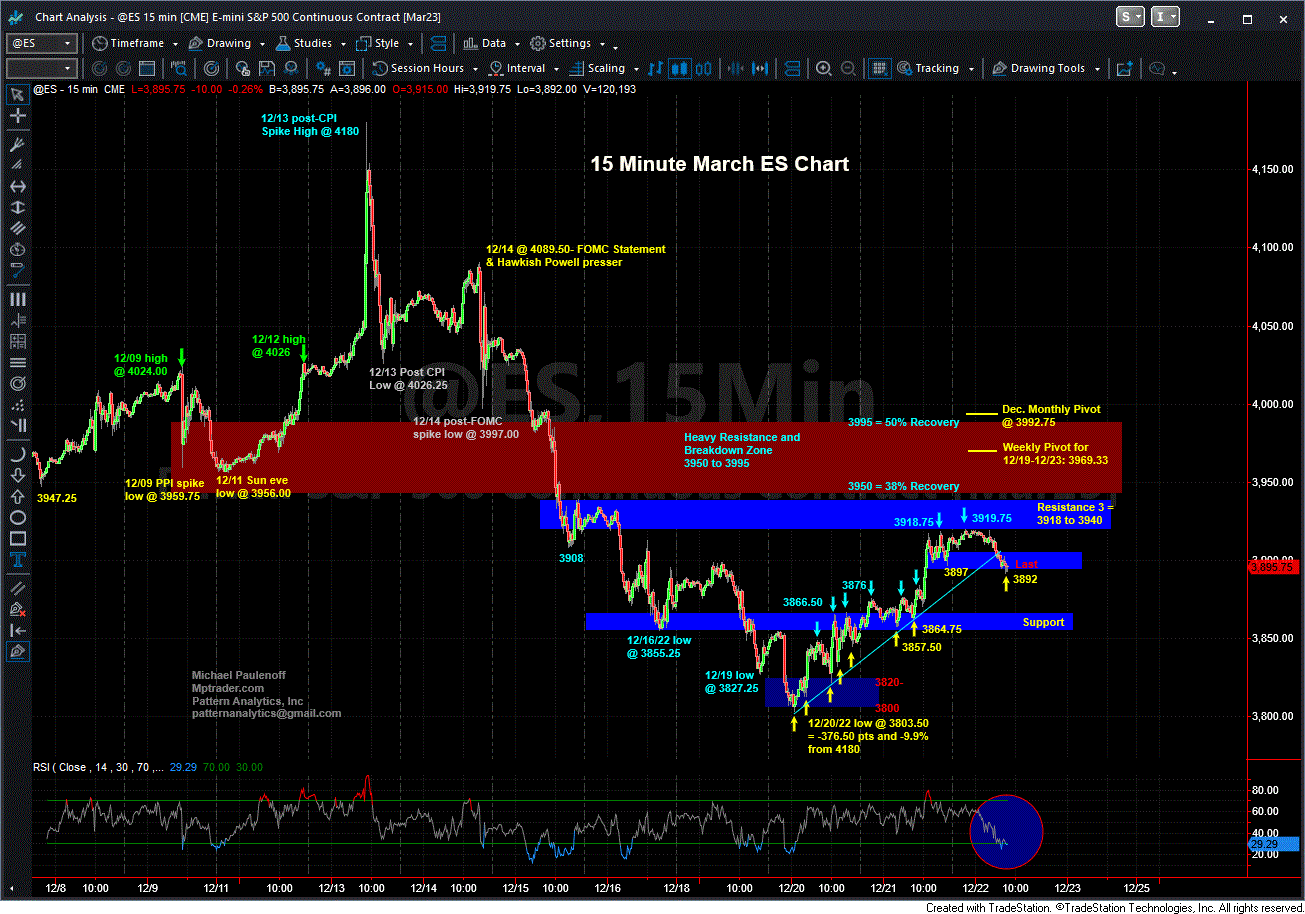
As for the markets (see ES Chart below data table), ES rolled over during the Pajama Trading Session from a two-day recovery rally high of 3919.75-- right in my designated "Resistance 3" Zone from 3918 to 3940 down below 3900 (3892 low so far), which my work argues signifies the conclusion of the recovery rally off of the 12/20 low at 3803.50. While this does NOT necessarily mean ES has rolled over into another downleg within the larger decline from the 12/13 CPI high at 4180.
As long as current weakness is contained above 3850, my pattern work argues for another recovery rally effort that points to a challenge of 3950, however, a break below 3850 means to me "all bets off" for another run at 3950, and instead, a retest of the 12/20/22 low at 3803.50 that if violated, will project to 3750 next...
Let's see if the 8:30 AM ET economic data (or David Tepper on CNBC now) trigger a surge in one direction or other ... Last is 3897.00...
Actual Previous Consensus


