Chart on TSLA - Market Analysis for Jun 13th, 2023

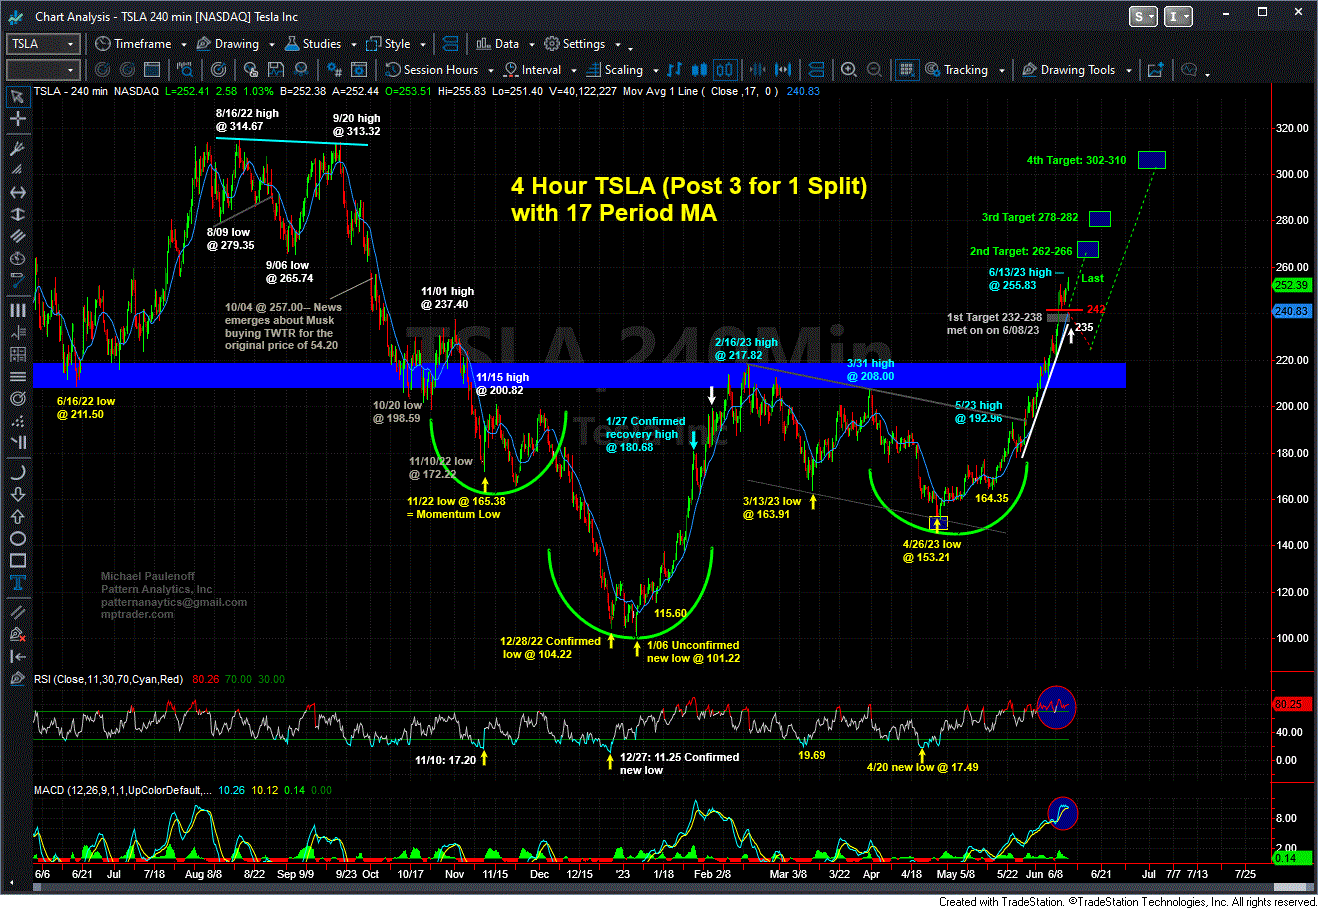
TSLA has climbed for yet another day to a new recovery high at 25.63 last seen in early October 2022. Unless and until TSLA breaks an initial meaningful technical support level at 242.00, the bulls will aim higher to a next optimal target zone of 262-266 where the advance will fill the down gap left behind on 9/30/22... Last is 252.81


  Matched
x
  • Action-Oriented Trade Set-Ups in Stocks & ETFs
  • Macro Analysis of the Broader Markets
  • Detailed Technical Guidance for each Trading Idea
  • Live Interaction w/ Mike & Our Member Community
  • And Much, Much More!
Join Now! - Special Offer!
Veteran Wall Street analyst and financial author, Mike provides detailed and timely analysis and trade set-ups on a range of markets. Read more...

Have Mike's “Out Front” morning analysis delivered FREE to your email inbox twice weekly!