Charts On Yield and TLT Ahead of Powell's Speech Tomorrow
 By
Mike Paulenoff
By
Mike Paulenoff
Good Tuesday Morning, MPTraders! December 3, 2024-- Pre-Market Update: The Street is starting to focus its attention on the upcoming macro catalysts approaching tomorrow afternoon (1:45 PM ET) with Fed Chair Powell's speech before an economic conference in Dallas, Texas, when he might provide hints about his "bias" for another Fed funds rate cut at the 12/18/24 FOMC meeting, which will pre-date Friday's monthly Jobs Report (The Street expects nonfarm payrolls to decline to 194,000 from 200,000 and the Unemployment Rate to 4.1% from 4.2%).
Indeed, according to the WSJ this AM, Fed funds futures indicate traders now see a 73% chance of another 0.25 percentage point cut in December, up from 59% a week ago. That would mark a third consecutive decrease, and would take rates down by a total of 1 percentage point for the year...
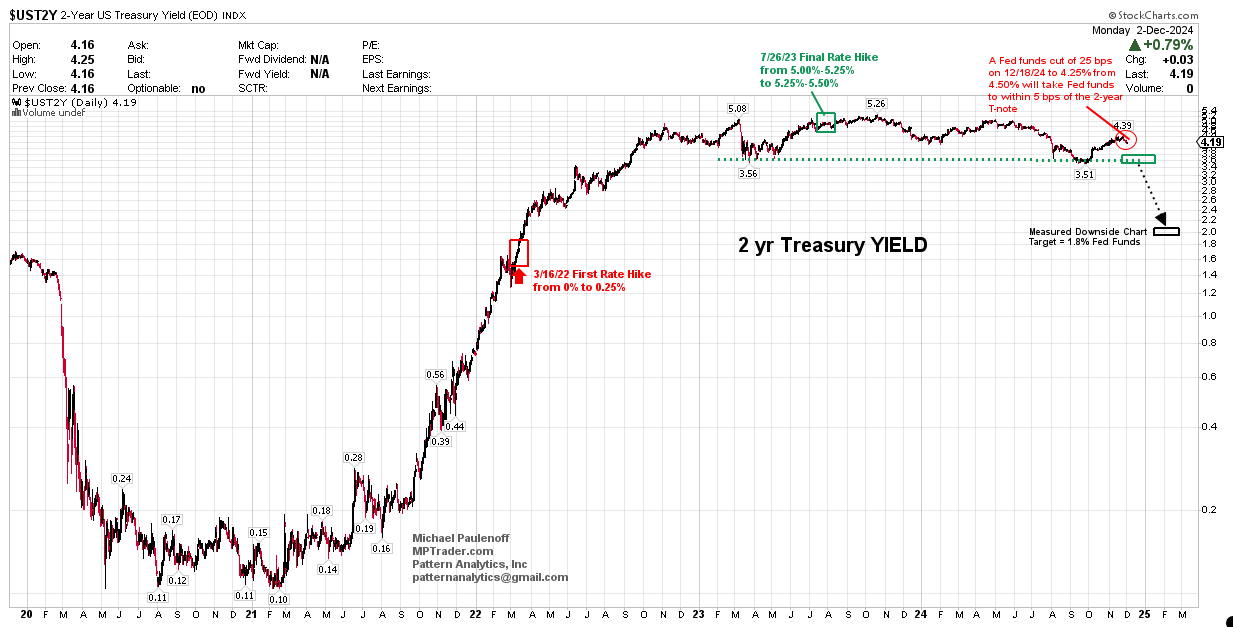
A 25 bps cut in rates will bring Fed funds down to 4.25%, a full 100 bps below the July 2023 hiking cycle high of 5.25%, and in the vicinity of where the 2-yr Treasury YIELD is trading, now at 4.19% (see my attached Chart)... Incidentally, from a technical perspective, only a Fed funds rate beneath 3.50% (another 75 bps of cuts) will trigger downside potential from a 2+ year top formation.
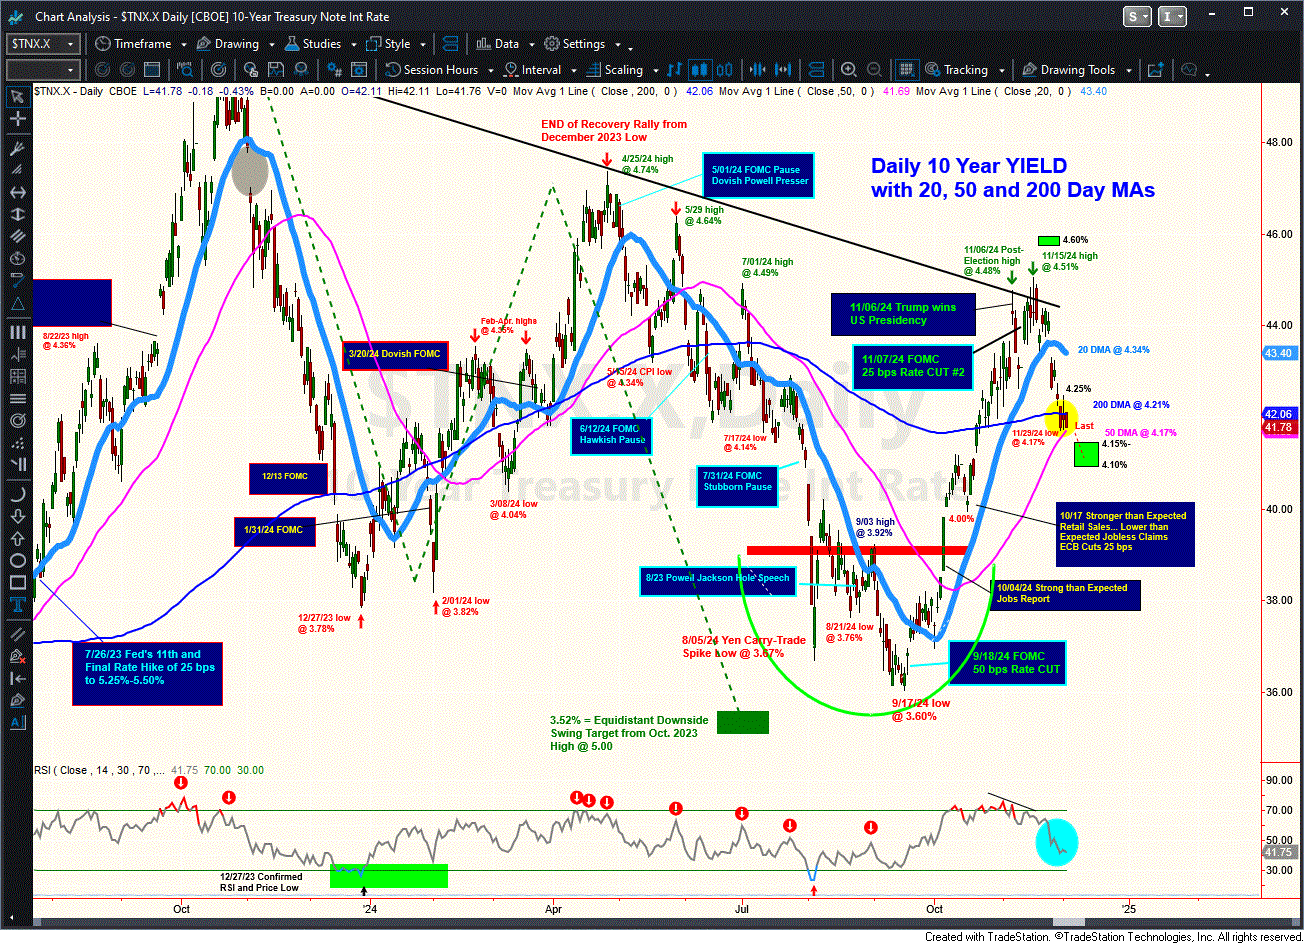
In terms of the longer end of the YIELD curve, let's notice on my attached Daily Chart of 10-year YIELD that the yield structure is making new three weeks lows beneath 4.17% as we speak, which is "threatening" to break below the up-sloping 50 DMA (4.17%). A sustained breach of 4.17% will point 10-year YIELD to my next lower target window of 4.15% to 4.10% (with the emphasis on 4.10%) off of the September-November upleg peak at 4.51%. The three week decline in YIELD dovetails with my technical expectation of "one last downleg in benchmark YIELD before the resumption of what my work warns us is a secular bull market in longer-term interest rates that started at the post-Pandemic low of 0.40% and hit its initial upleg high at 5% in October 2023. If my YIELD work proves reasonably accurate, then somewhere in the vicinity of 4.00%
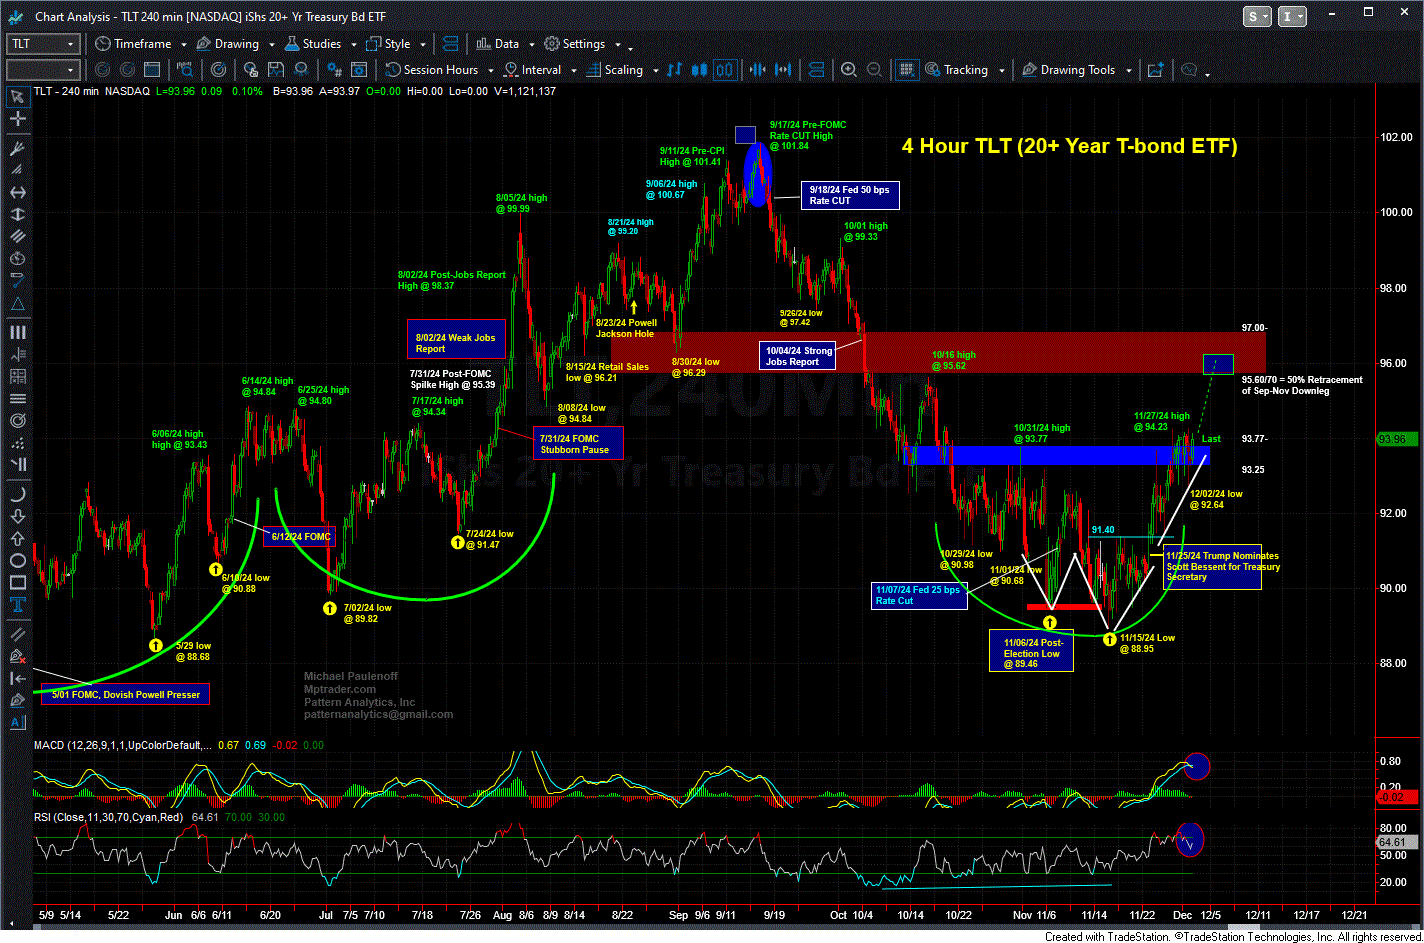
What does that mean for TLT (20+ Year T-bond ETF)? My attached 4-Hour Chart points higher, toward my next optimal target zone of 95.70-97.00...