Charts on BAC, GS & JPM
 By
Mike Paulenoff
By
Mike Paulenoff
Good Tuesday Morning, MPTraders! April 18, 2023-- Pre-Market Update: More earnings today as equity index futures grind higher overnight...
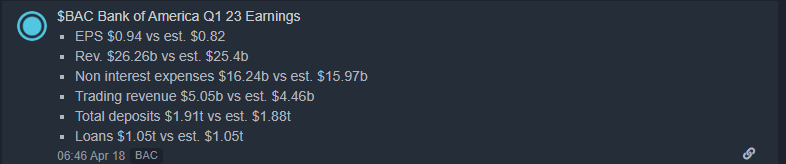
First up, BAC beats on all metrics...
 FinancialJuice
... which has goosed the stock price 2% higher to challenge an initial zone of resistance from 31.35 to 32.80 that must be taken out to position BAC for a much more consequential confrontation with its dominant down trendline from BAC's ATH at 50.11 (2/10/22), which cuts across the price axis in the vicinity of 34.60 (see my attached 4-Hour Chart). Useless and until BAC bulls propel the stock above its dominant down trendline, my work considers current strength as a recovery rally within a still dominant larger corrective period...
As for GS (Seeking Alpha)...
- Goldman Sachs press release (NYSE:GS): Q1 GAAP EPS of $8.79 beats by $0.69.
- Revenue of $12.22B (-5.5% Y/Y) misses by $440M.
- Annualized return on average common shareholders’ equity (ROE) was 11.6% and annualized return on average tangible common shareholders’ equity (OTC:ROTE) was 12.6% for the first quarter of 2023.
- Assets under supervision increased $125 billion during the quarter to a record $2.67 trillion.
- Book value per common share increased by 2.3% during the quarter to $310.48.
The convoluted revenue miss put the kibosh on investor reaction to the news. GS reversed from up $5/share to down $12/share in the aftermath of earnings. My attached 4-Hour Chart shows that the GS rally into earnings reversed right at key resistance from 336 to 342, which has the right look of the completion of a counter-trend rally. As long as GS weakness sustains beneath 330, my pattern work argues for additional weakness into the 315 area, and if violated, a press to revisit the March low-zone from 306 to 298... Last is 327.00...
Finally, let's check in on JPM, which has climbed nearly 10% from last Friday's earnings report. My attached 4-Hour Chart shows the vertical upmove that is approaching extremely powerful and consequential resistance from 141 to 144. Unless and until the resistance zone is hurdled and sustained, my work cannot get "excited" about JPM as a longer-term "Buy and Hold" setup... JPM is still a rental... Last is 139.50