Charts on ES & NVDA: Does something have to give? Yes, but not yet!
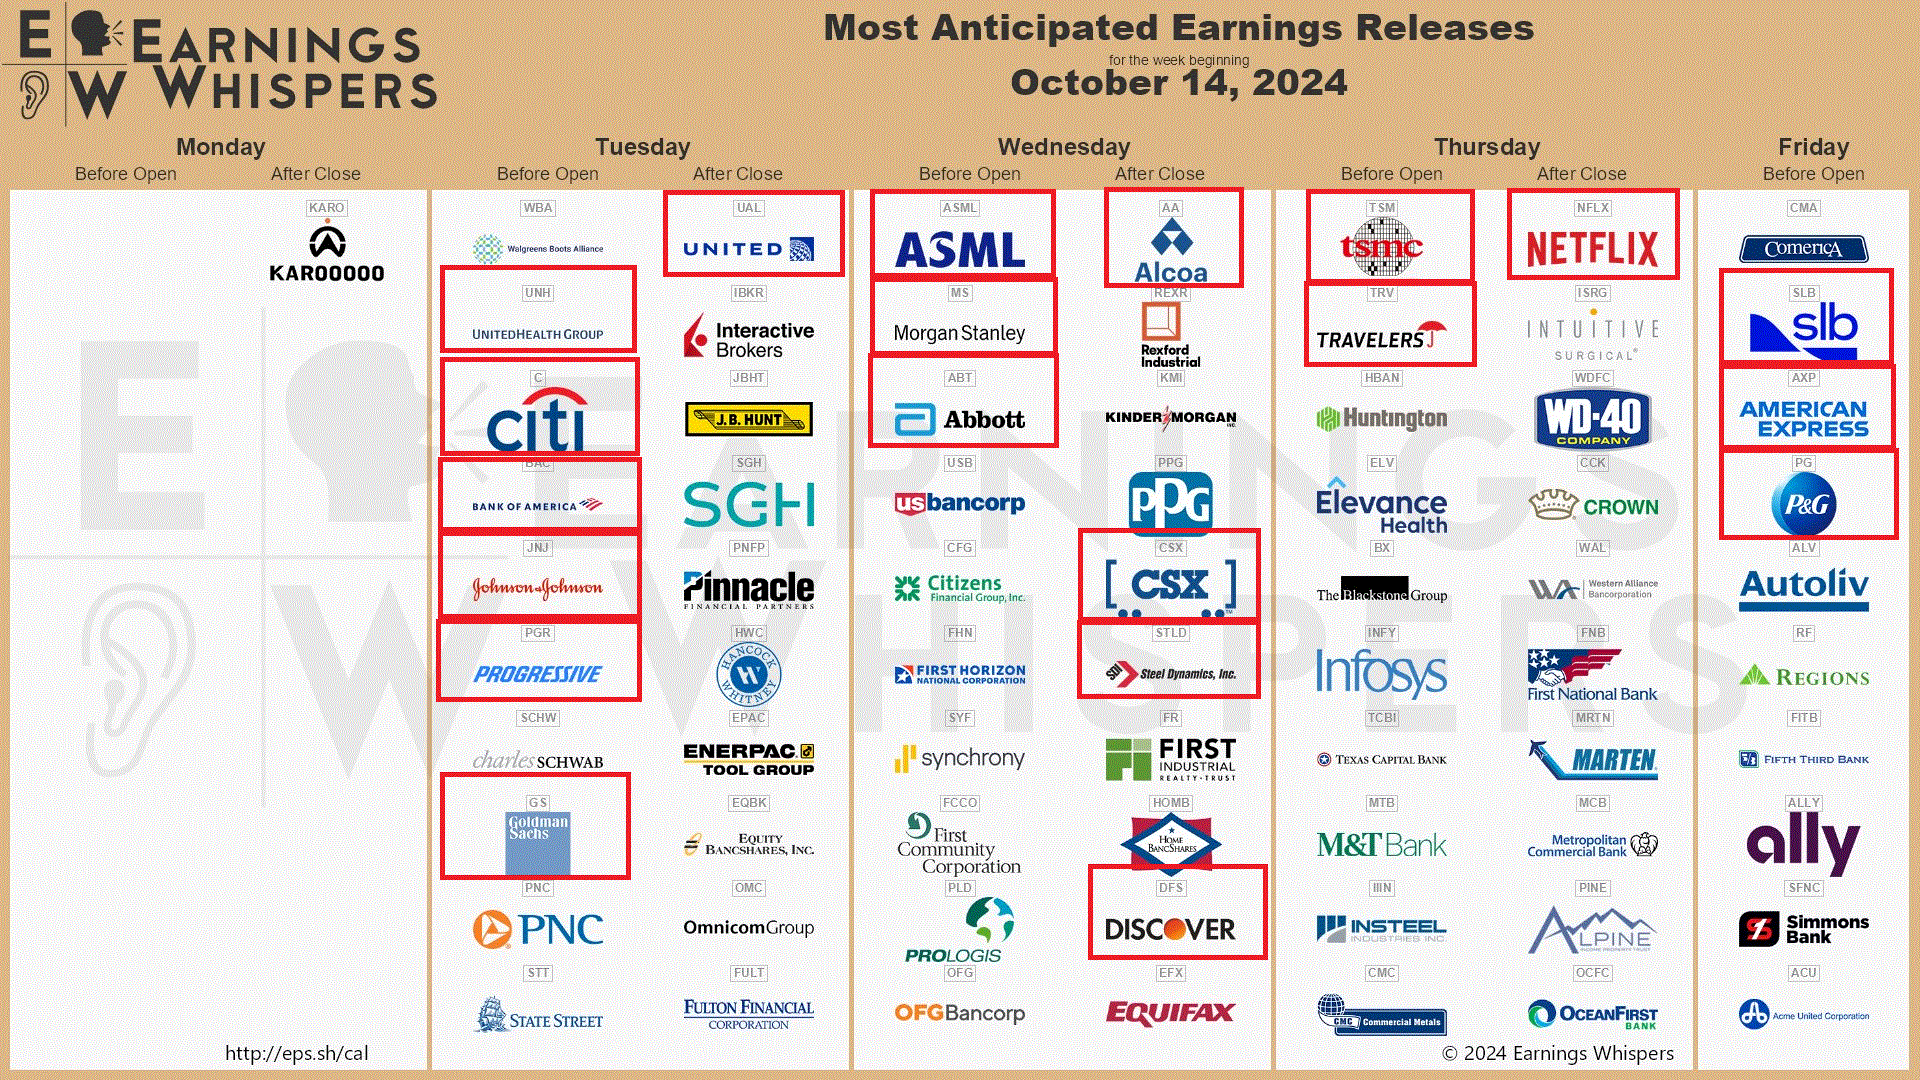
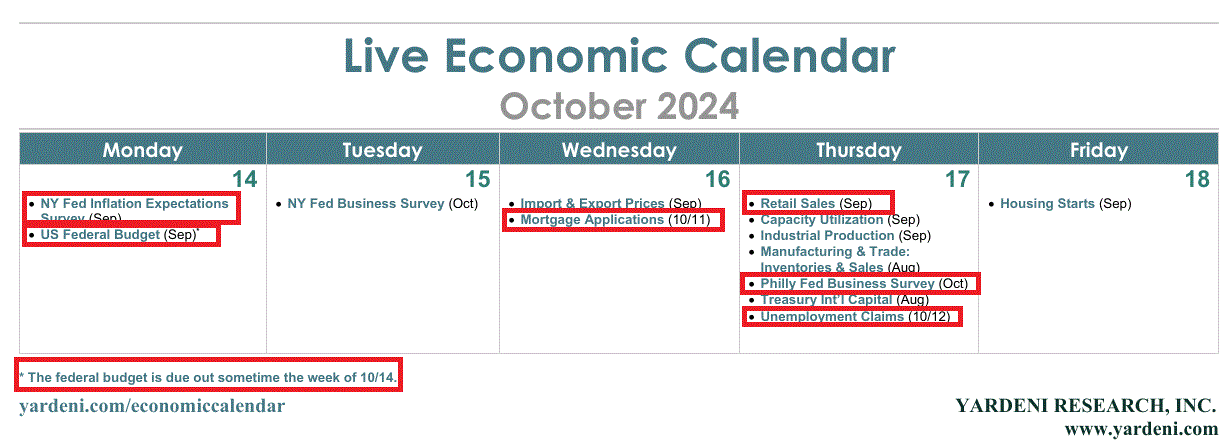
Good Monday Morning, MPTraders! October 14, 2024-- Pre-Market Update: We start an active week of Earnings and some important economic data amid still-rising Political/Geopolitical Tensions. Equity indices push new all-time highs on a daily basis while benchmark longer-term interest rates back up. Does something have to give? MJP Answer: Yes, but not yet!
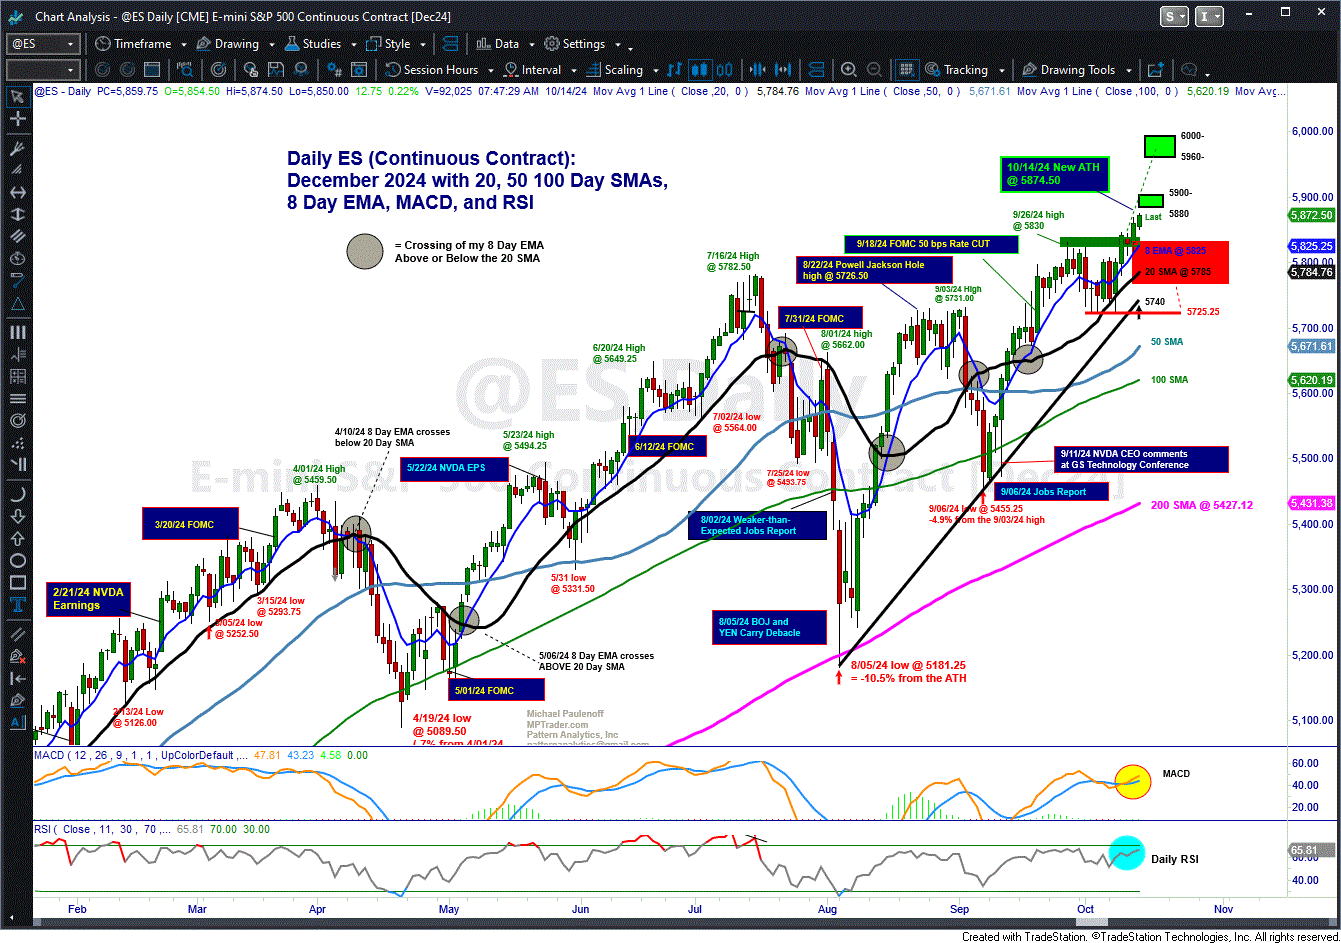
Let's get our bearings on this Monday morning with my attached Big Picture Daily Chart of ES (S&P E-mini Futures), which we see has climbed to another, albeit marginal, new ATH at 5874.50 this AM as the index nears my next optimal upside Target Zone of 5880 to 5900.
The juxtaposition of my rising 8-Day Exponential and 20-Day Simple "positional Trading MAs" exhibits what has historically been a very bullish setup and has been a precursor to the initiation of a sustained new upleg and possibly an indication of a forthcoming FOMO-Q4 melt-up scenario.
As long as any forthcoming acute ES weakness is contained above or within support lodged from 5825 down to 5785, the bulls will remain in directional control, and as such, the "sustained upleg and/or the FOMO-Q4 melt-up scenarios will underpin market action and directional potential... Last is 5870...
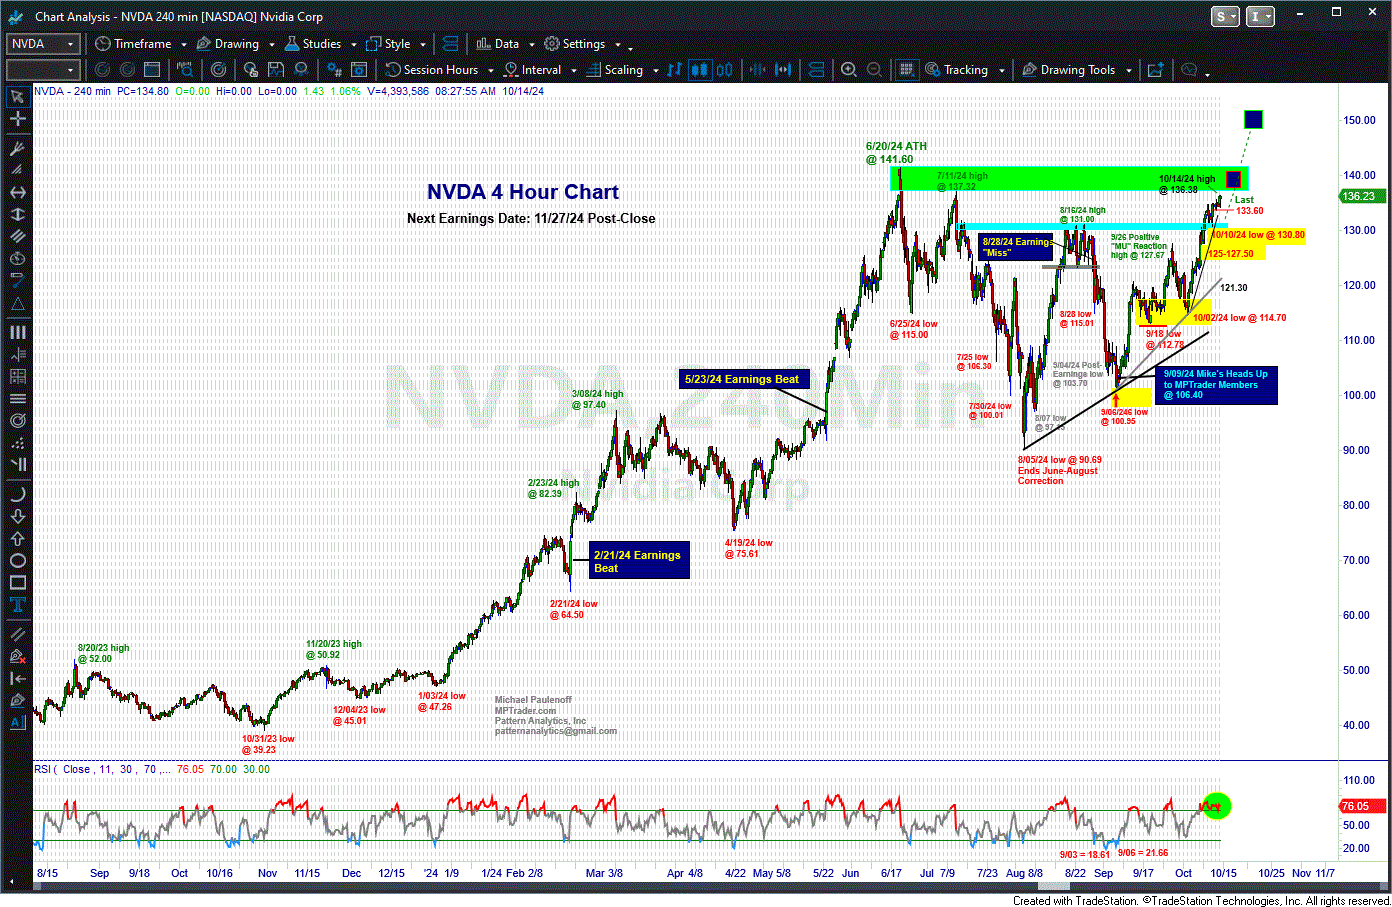
Also attached below is my 4-hour Chart of NVDA, which is 1.2% higher in pre-market trading and has pushed up to a new post-August and three-month high at 136.47 (as we speak). As long as any forthcoming intraday weakness is contained above nearest support at 133.60, NVDA will be positioned for still-higher prices that point to a challenge of the July ATH-zone from 137.32 to 141.60.
Only a bout of weakness that breaks 133.60 and follows-through below 130.80 will trigger a meaningful technical downside reversal in my work... Last is 136.47...


