Charts on GLD and DXY
 By
Mike Paulenoff
By
Mike Paulenoff
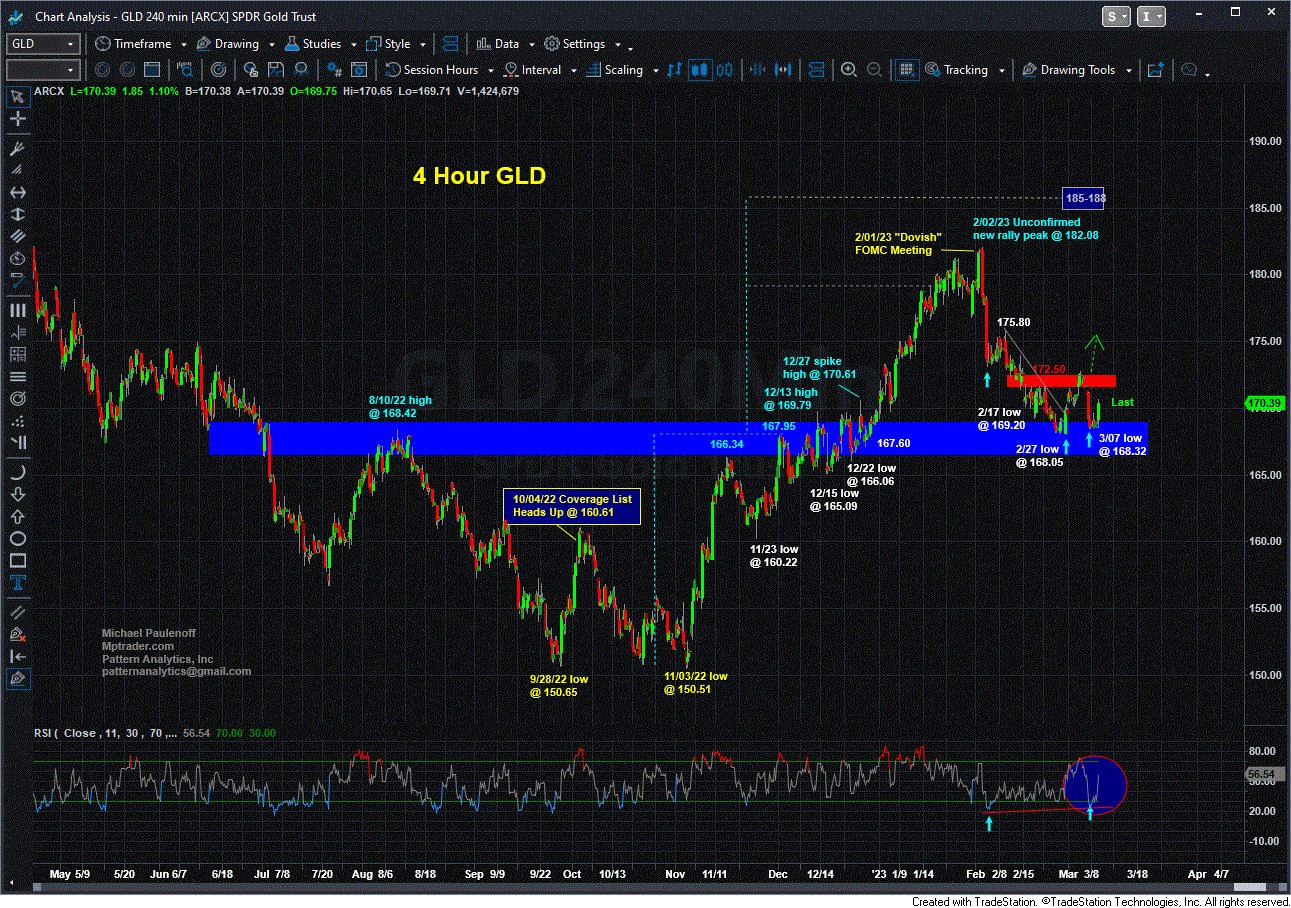
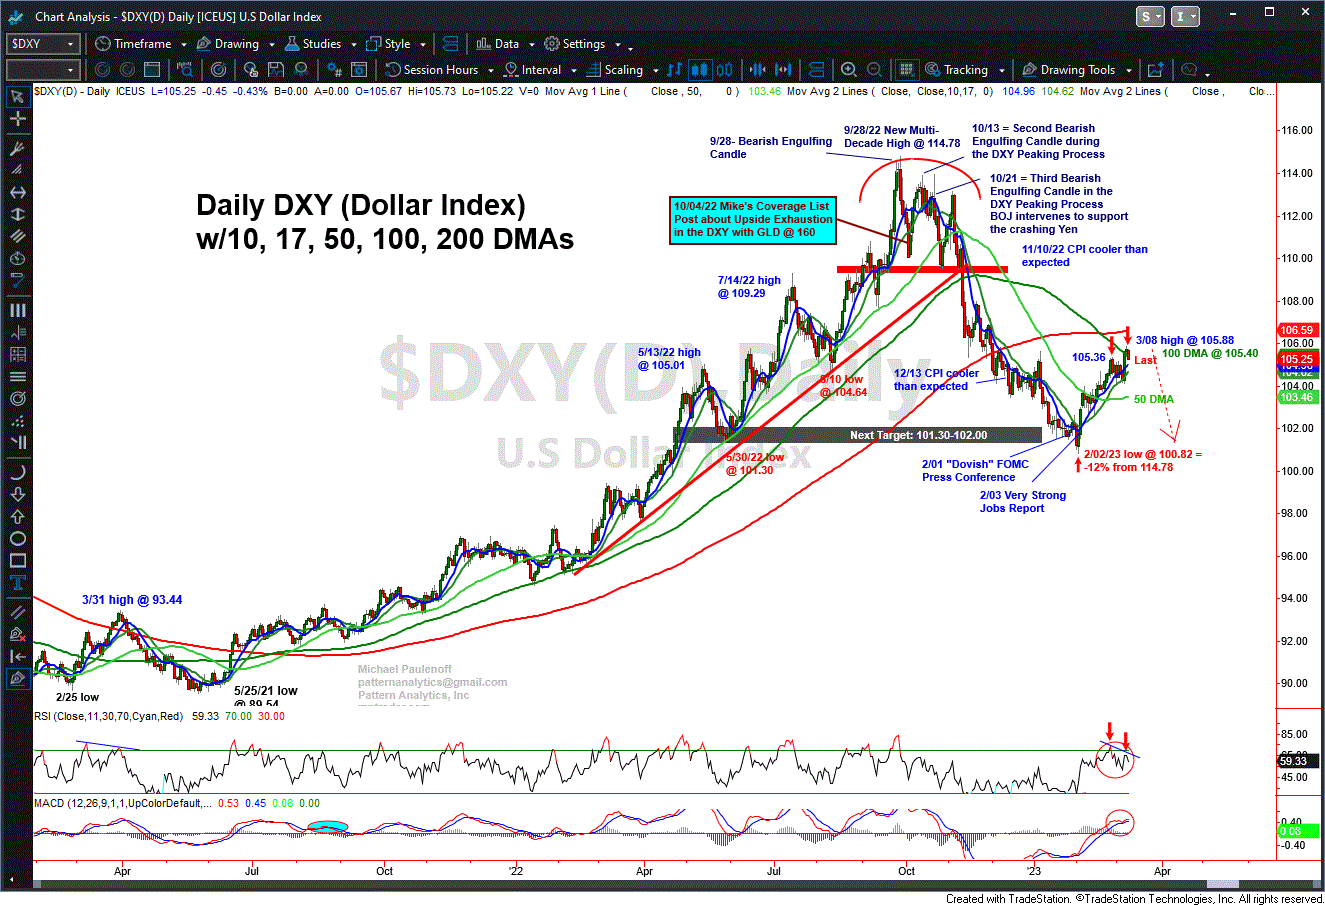
GLD and DXY (Dollar Index)-- Although at the moment GLD is not generating a powerful upside reversal signal-- it needs to climb above 172.50 to do so, what IS more intriguing is the Negative Momentum Divergence exhibited by the DXY Daily technical setup (see below the GLD chart).
At the moment, DXY has the right look of a completed recovery rally from its 2/02/23 low at 100.82 to yesterday's (3/08/23) high at 105.58, where is smacked into a sharply downsloping 100 DMA that for the time being has repelled the upmove that registered a lower Momentum reading compared with its 2/27/23 confirmed rally high at 105.36.
This negative divergence is a warning signal that the recovery rally of 4.5% in the aftermath of a multi-month bear leg of -12% is exhausted on the upside, presumably leaving DXY vulnerable to a resumption of dominant downtrend weakness.
Of course, the reaction to tomorrow's Jobs Report will be pivotal for both the Dollar and GLD. If the data come in on the weaker side of expectations, then GLD above its near-term breakout plateau at 172.50 accompanied by tailwinds from DXY weakness certainly seems to be in the cards...