Charts on JPM, ES & 10-Year Yield
 By
Mike Paulenoff
By
Mike Paulenoff
Good Tuesday Morning, MPTraders! January 13, 2026-- Pre-Market Update:
-- JPM Earnings: Mostly a beat (see CNBC analysis below), but considering JPM was trading 65% above its April 2025 low (see my attached 4-Hour Chart), the reaction to the news has been a bit muted (as we discussed late yesterday here).
As we speak, JPM is up 0.2%. Technically, as long as key resistance from 332 to its ATH-zone 335-338 remains intact, my pattern setup argues for a bout of corrective weakness that presses the stock into the 290-310 support plateau before renewed, powerful, and sustained buying interest emerges... Last is 324.97...
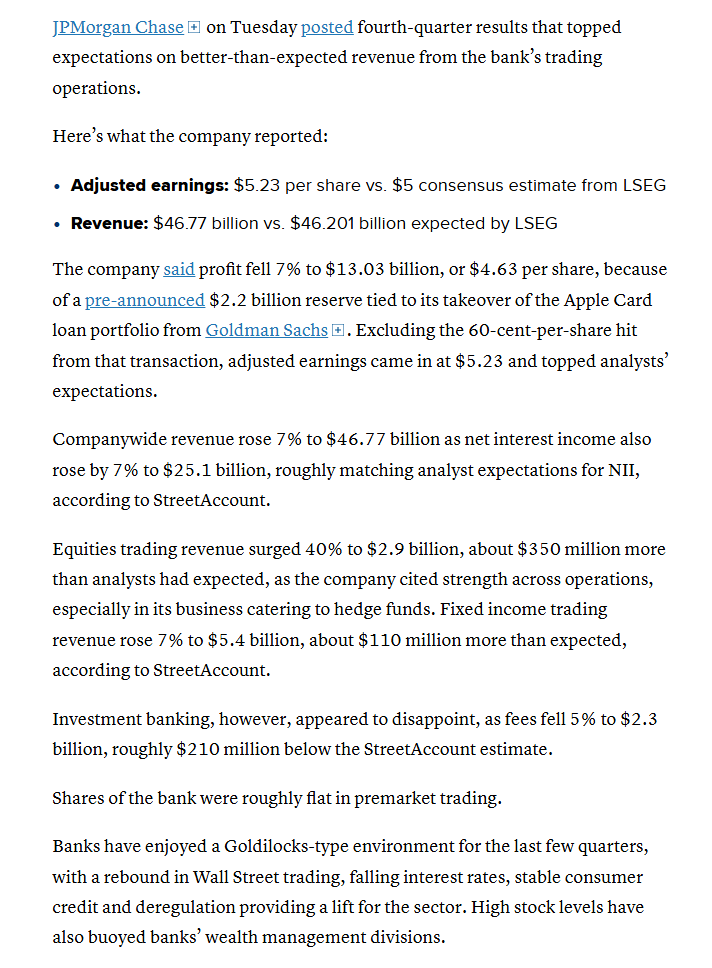
From CNBC about JPM Earnings:
(Continued below myJPM Chart)
At 8:30 AM ET, we get the next round of inflation data:
Here are the Estimates:
US CPI YoY Forecast 2.7%, Previous 2.7% Range 2.9% / 2.5%
US CPI MoM Forecast 0.3%, Previous 0.2% Range 0.5% / 0.1%
US Core CPI YoY Forecast 2.7%, Previous 2.6% Range 3.1% / 2.6%
US Core CPI MoM Forecast 0.3%, Previous 0.2% Range 0.5% / 0.2%
ES: Heading into the data, as long as any forthcoming weakness is contained above 6930/50, the pattern setup argues the bulls will remain in directional control, eying a run at 7100-71300 next... Last is 7007.00...
As for 10-year YIELD, all eyes are on resistance (see chart below) at 4.20%-4.22%, which, if hurdled and sustained, will raise some eyebrows, especially from the Bond Vigilantes...