Charts on TLT & ES As 10-Year Yield Continues To Lift
Good Thursday Morning, MPTraders! August 3, 2023-- Pre-Market Update: Today is ALL about Weekly Jobless Claims at 8:30 AM ET (followed by ISM Services and Price Data at 10 AM ET)-- the response of the bond market, the reaction to AAPL and AMZN Earnings after the close (representing 10% of the SPX and 17% of the NDX), and trader positioning ahead of tomorrow's July Employment Report...
Earlier this AM, Challenger Jobs Cuts data shows consideraby FEWER-THAN-EXPECTED cuts, which dovetails with fewer Job Openings reported and stronger-than-expected ISM Manufacturing data reported on Tuesday, following relatively strong GDP figures (2.4% vs. 1.8% consensus) and the most recent Atlanta Fed GDPNow estimate of 3.9% for Q3, 2023!
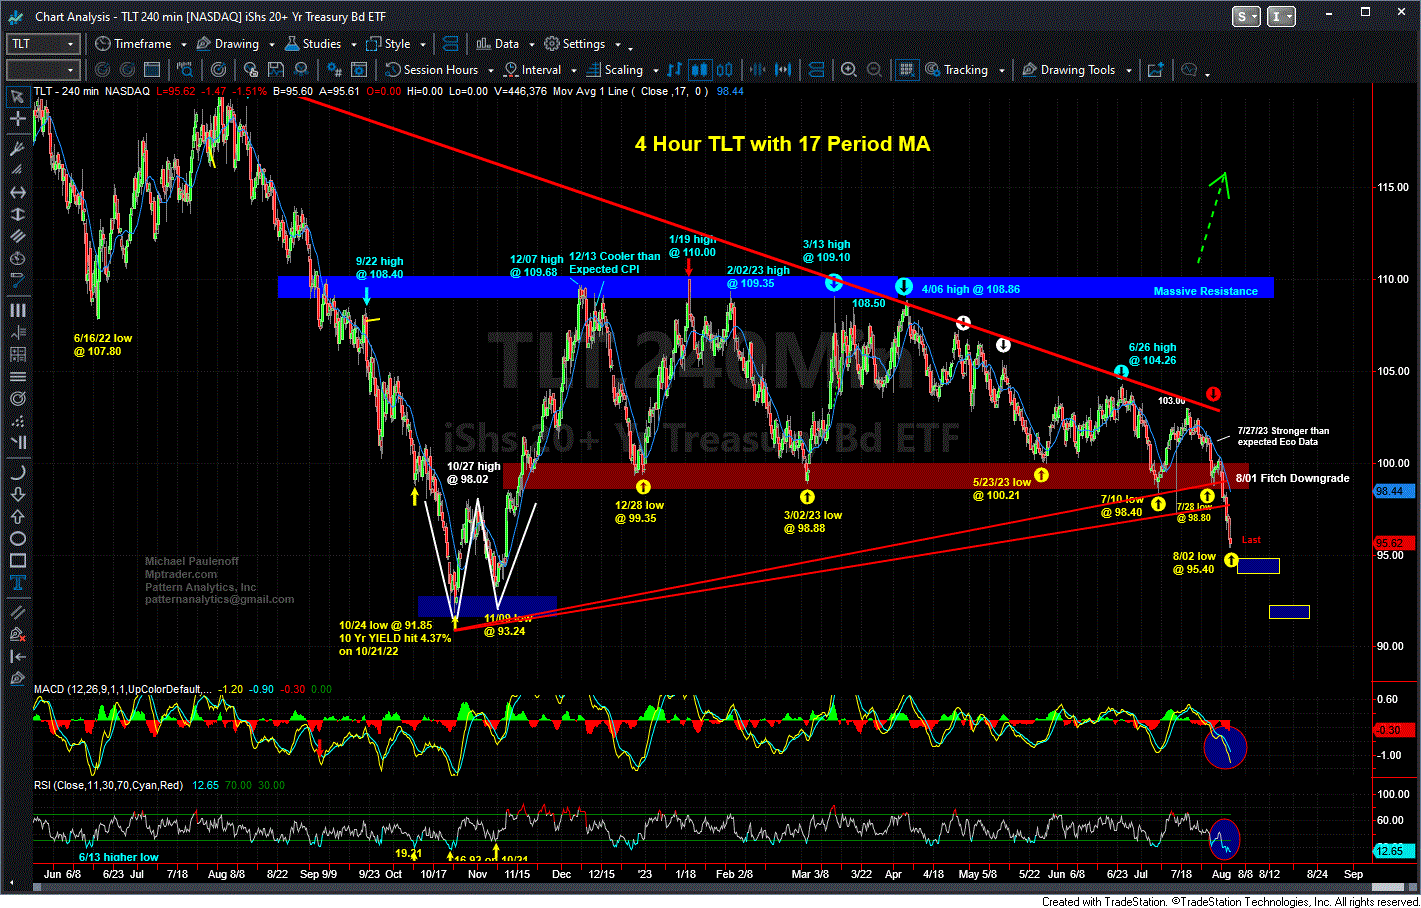
No wonder 10-year YIELD continues to lift, hitting a high of 4.14% this AM so far! My attached 4- Hour Chart of TLT (20+ Year T-bond ETF) shows its continued decline (TLT is inversely related to the direction of benchmark YIELD) as the price structure presses lower toward a full-fledged retest of the October-November 2022 low-zone from 93.25 to 91.85. At this juncture, a powerful rally and close ABOVE 100.20 is required to neutralize the currently powerful breakdown from a 9-month support plateau... Last is 95.60
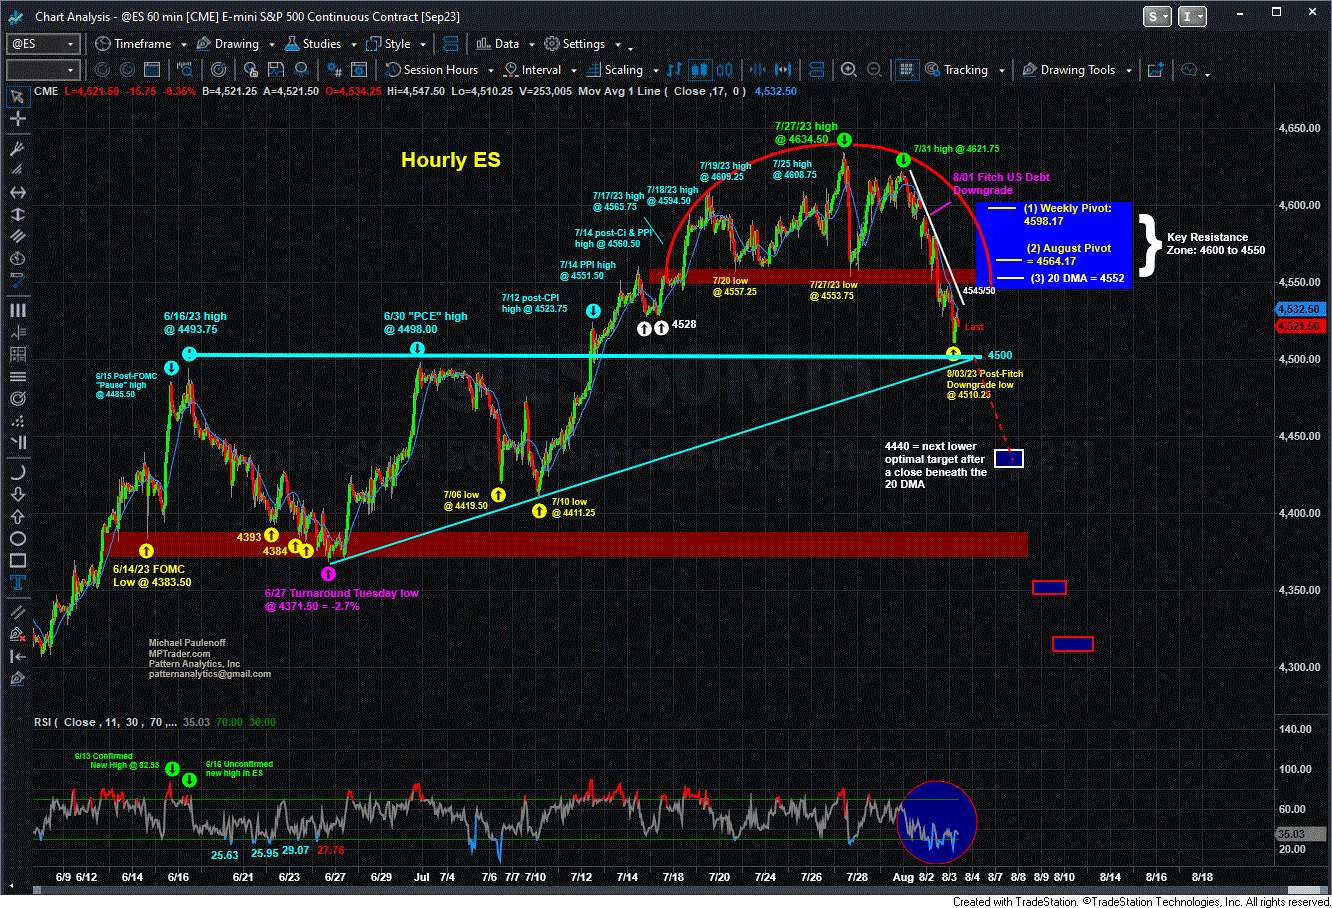
As for ES, recent weakness is the result of an extended (exhausted) relentless upmove from the 5/24/23 NVDA pivot low at 4158 to the 7/27/23 high of 4634.50 (+11.5%) AND an interest rate shock (at the long end of the curve) triggered by the Fitch Debt Rating Downgrade. My attached Hourly Chart argues that unless and until ES claws its way back above key nearest resistance at 4545-4550, the bears will remain in directional control eyeing a full-fledged test of 4500 (last eve's low was 4510.25), and if (when?) violated, toward my next optimal target zone in the vicinity of 4440/50... Last is 4519.00... More after the first tranche of economic data...


