Crude Oil, XOP, Pressuring Resistance
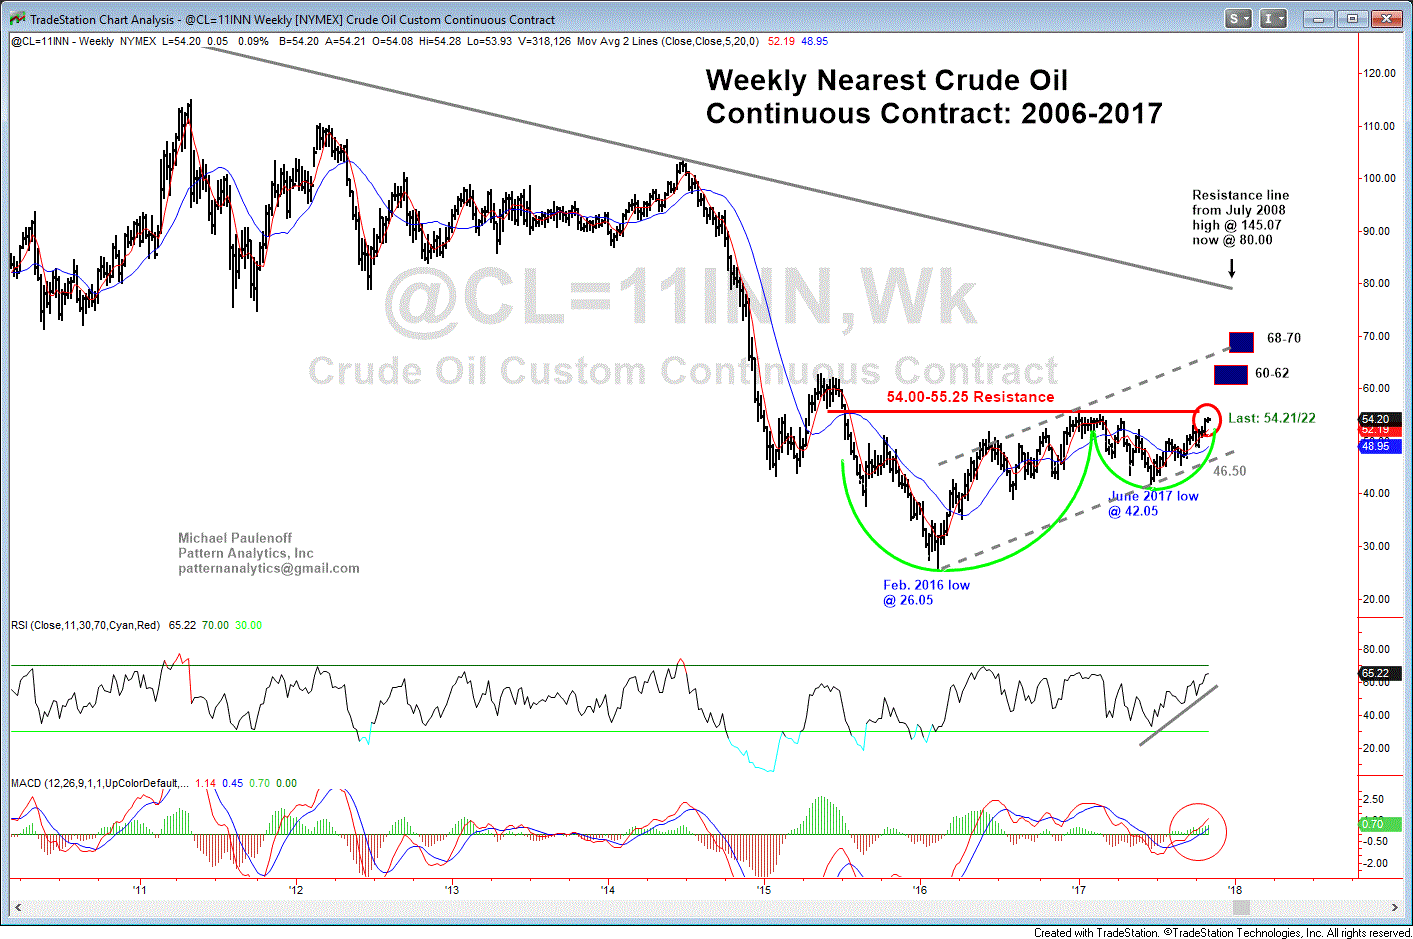
Certainly, upside continuation in the underlying commodity, Crude Oil, could be hugely supportive for XOP (Oil & Gas Exploration ETF). Let's notice on the enclosed Weekly chart of crude, that the price structure is putting upward pressure on key resistance between 54.00 and 55.24, which if hurdled and sustained, will trigger higher projections into the 60-62 and possibly 68-70 target zones.
All of the price action off of the the Feb. 2016 low at 26.05 represents an incomplete intermediate term recovery rally period that has taken the form of a 2-1/2 year Cup and Handle accumulation pattern. The pattern is relatively mature, with the price structure poised for an upside thrust from the Handle portion of the pattern.

