DXY and ABX Doing A (Bullish) Dance?
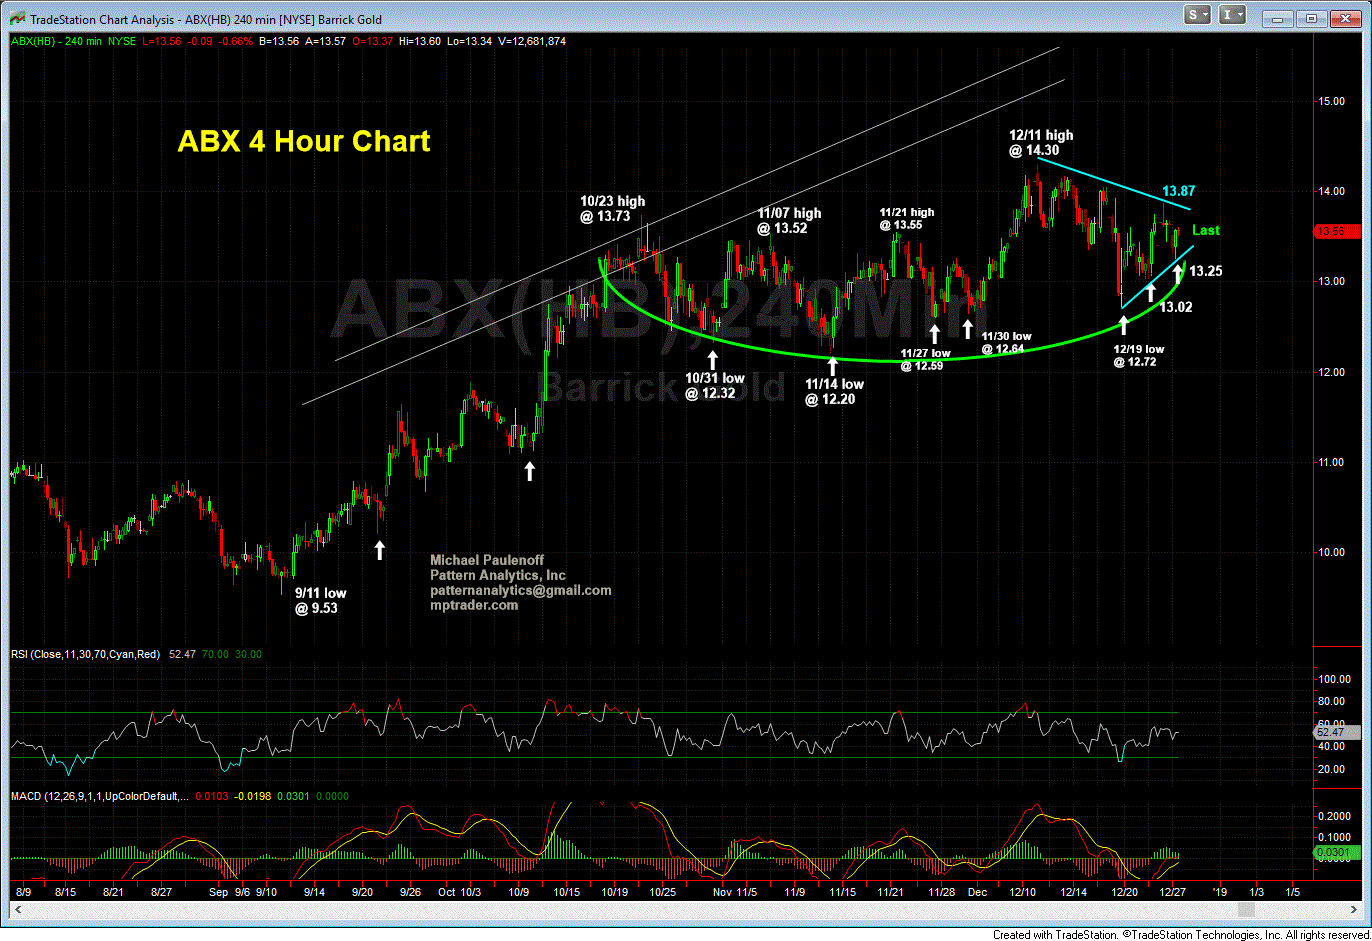
ABX and DXY-- My near term chart work in ABX suggests strongly that all of the action off of the 12/11 high at 14.30 is taking the form of a high level bullish Coil or Continuation pattern, presumably ahead of a pop to the upside.
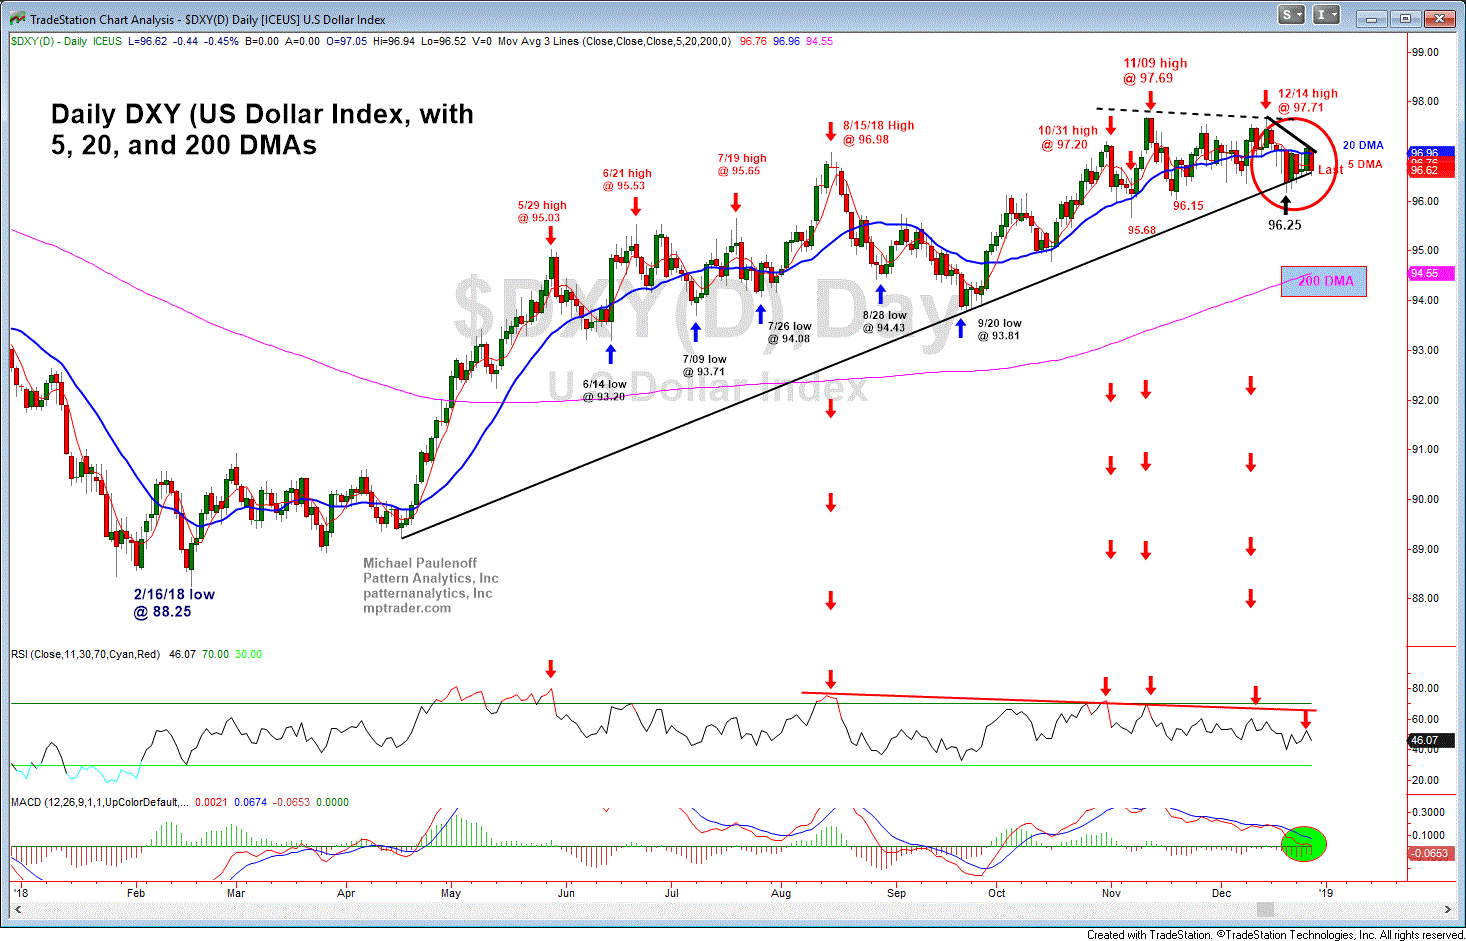
Interestingly, all of the action in DXY off of its 12/14 high at 97.71 appears to be a continuation pattern, but poised to break to the downside after multiple failed attempts to hurdle its 20 DMA, now at 96.96.
My suspicion is that it is not a coincidence that ABX is poised to take off at the same time DXY is poised to drop out of its heretofore powerful uptrend.
Watching for DXY weakness to propel ABX (and the PMs) higher... Last in ABX is 13.61... DXY 96.54


