Directional Turn (Up) Anticipated for Gold
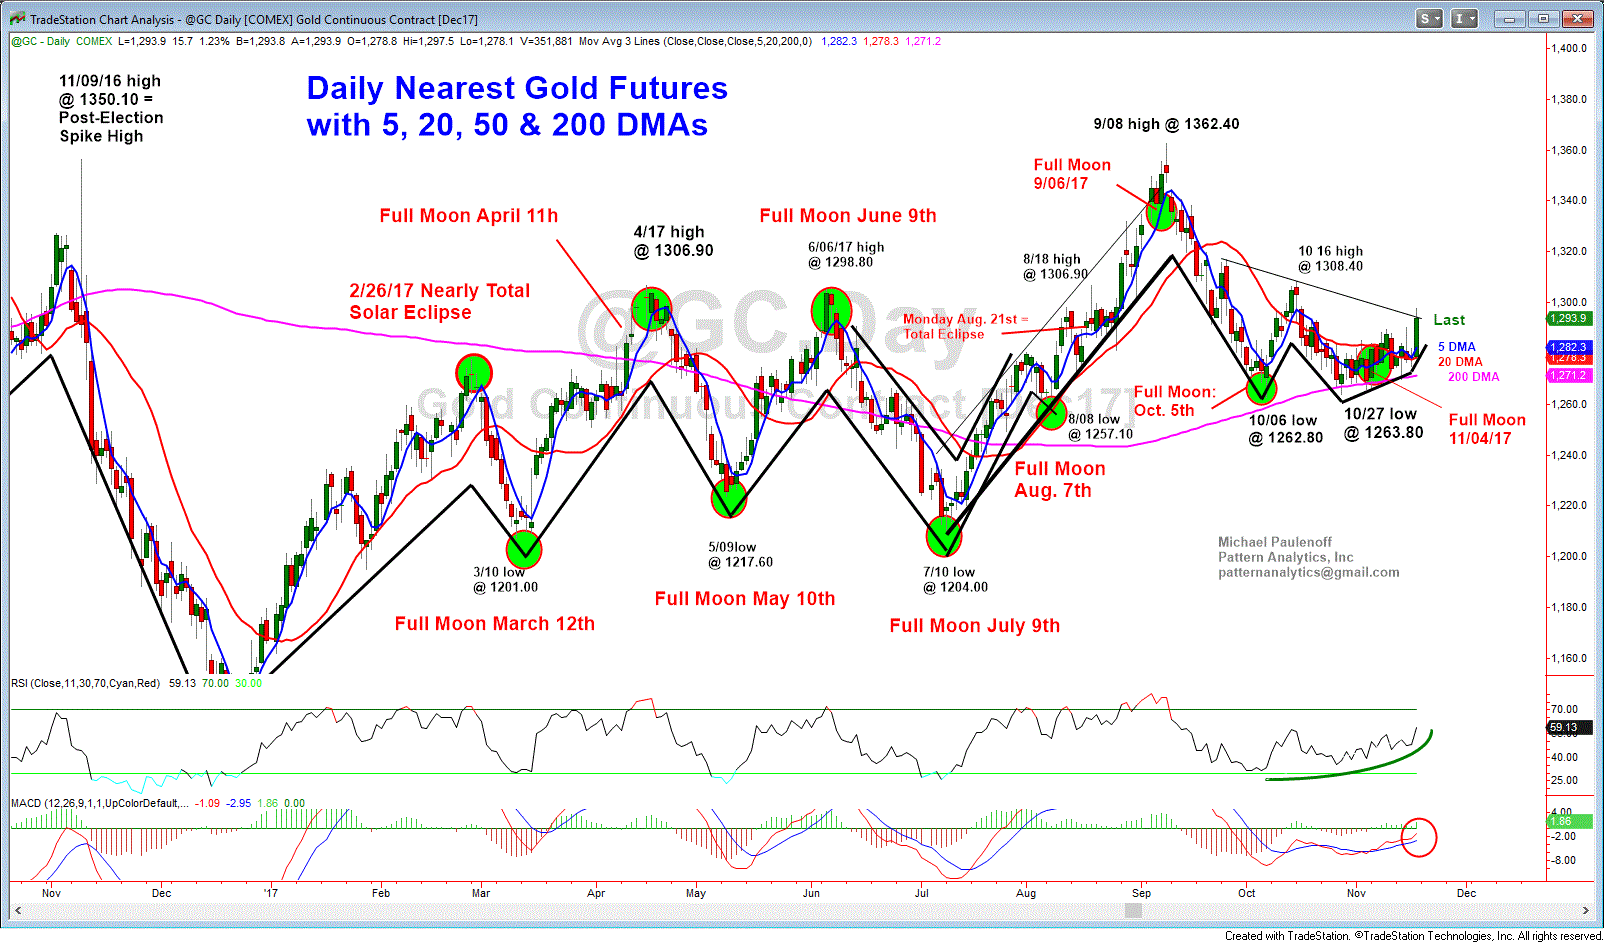
Here is my updated Dec. Gold chart, overlaid on the dates of the Full Moon during 2017, which much more often than not coincide with directional turns. As of this moment, the most recent Full Moon on Nov. 4th appears to be associated with an upturn in price.
A close in Dec. Gold above 1295 will position the price structure above its Oct.-Nov. resistance line, and also will represent a thrust off of a confluence of trading and trendling MAs-- 5, 20, and 200, which usually signals the initiation of a new directional price move, in this case, to the upside.

