Dollar Challenging Resistance - Market Analysis for Apr 23rd, 2018
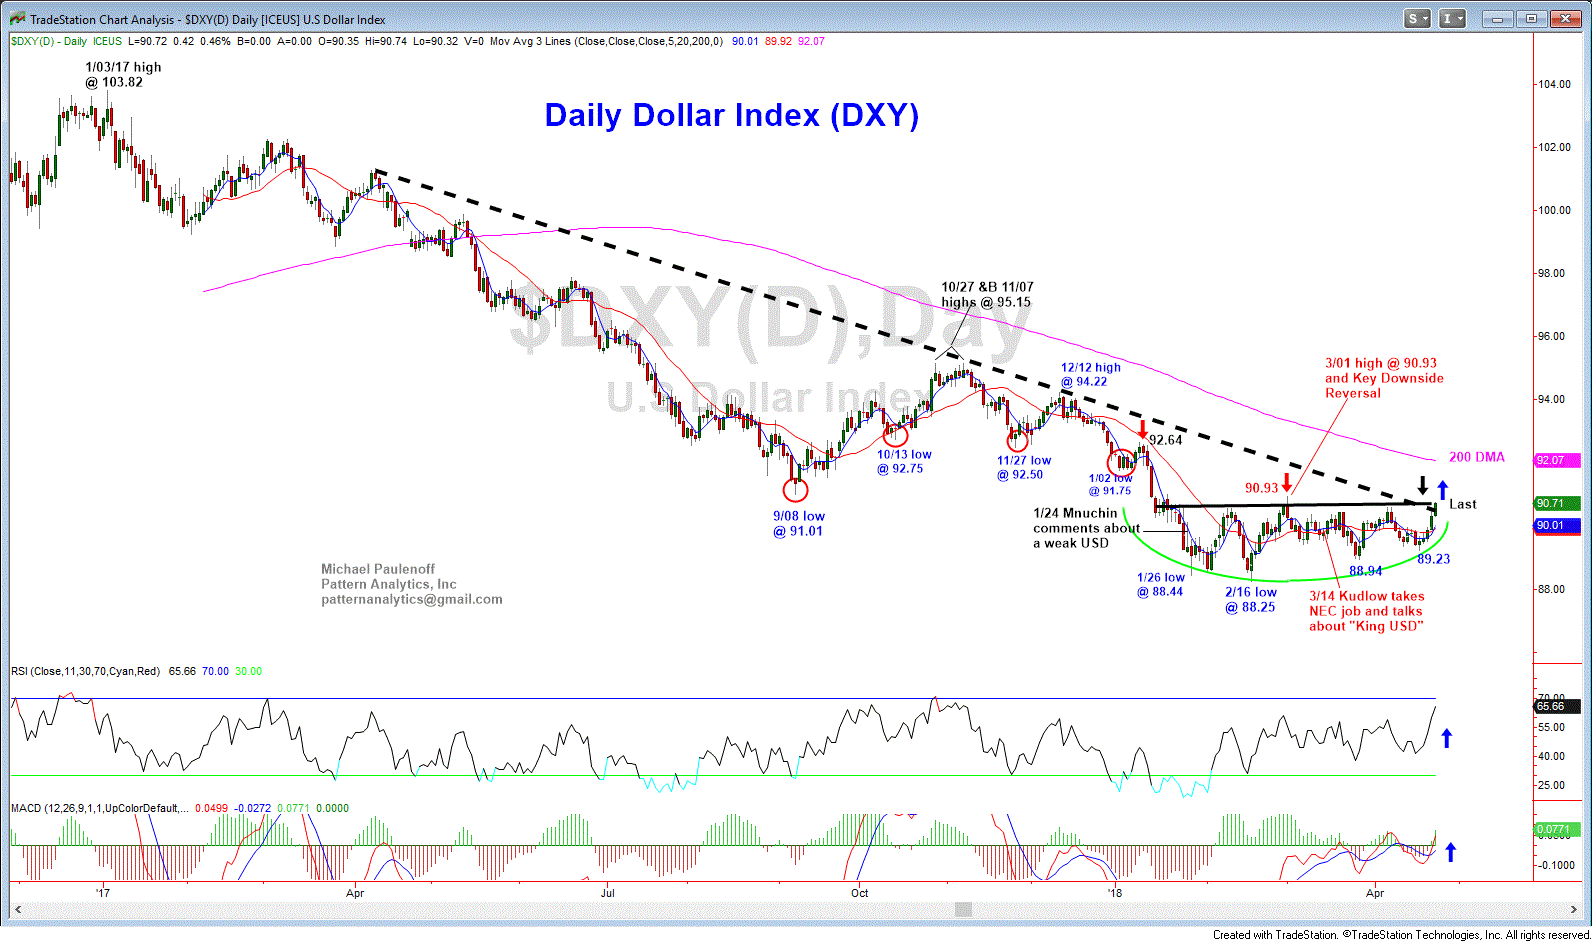
About the Dollar Index (DXY)-- One look at the near term (daily) chart set up suggests strongly that DXY is attempting to emerge from a three month accumulation pattern as it challenges resistance at 90.90-91.00, which if hurdled and sustained, will point to a confrontation with its down-sloping 200 DMA, now at 92.07.
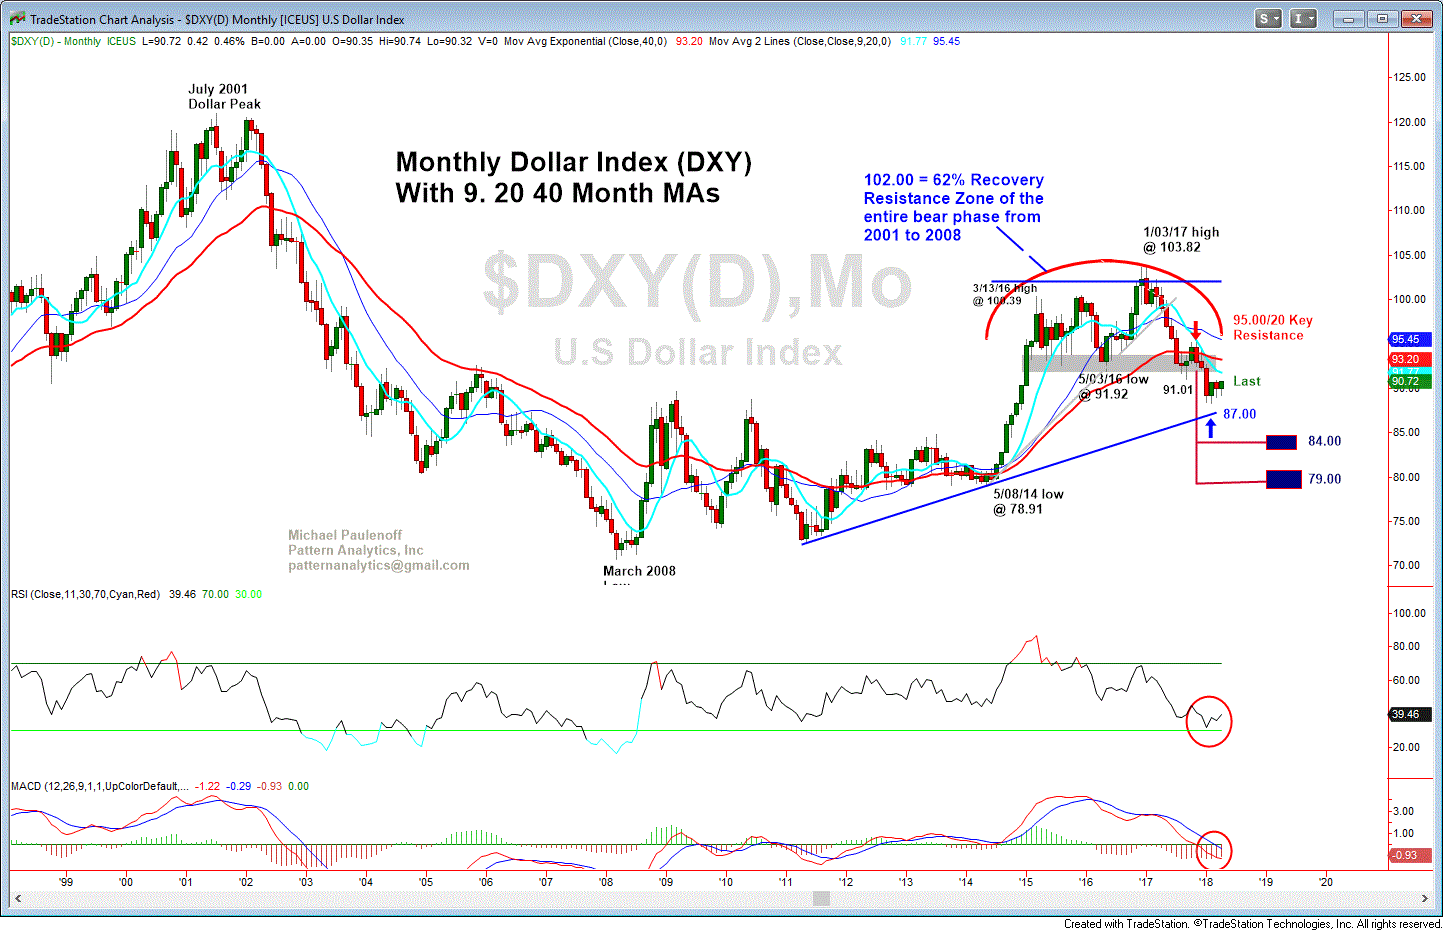
The three month pattern, however, exhibits counter-trend form, which if accurate means that the strength represents a pause after a 14 month decline from 103.82 to 88.25, or - 15%. Fit into a larger context, such as my monthly chart (see below), DXY also points to upside potential in the vicinity of 92.00, where it will smack into serious three year resistance.
My sense is that IF in fact DXY can manage to claw its way above 91.00 on a closing basis that its upside will be limited and a relief rally ahead of another intense bout of dominant downtrend weakness.
In the meantime, the precious metals and commodity markets might experience some Dollar headwinds.... MJP


