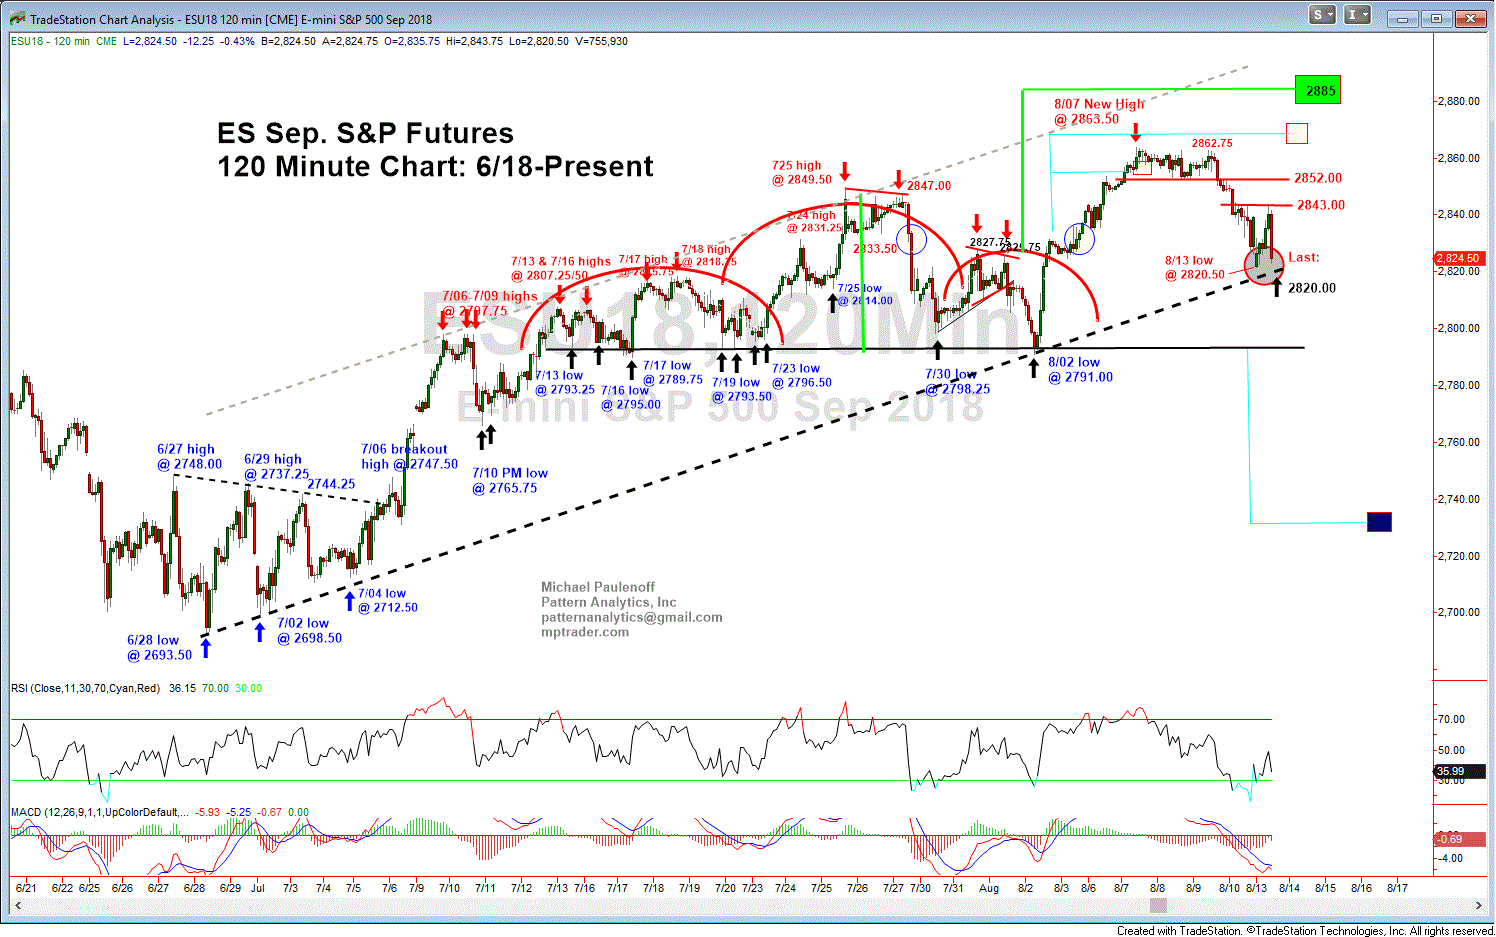
E-Mini Sep. S&P is at a Key Inflection Zone
ES (e-mini Sep. S&P)-- Earlier this AM, we questioned whether or not the overnight low at 2820.50 ended a correction off of the 8/07 high at 2863.50, or represented an initial decline within a larger-developing correction? The ES recovery rally peaked at 2843.75 at the top of the first hour of trading, but reversed, and has been under pressure for the past 2 hours, and has revisited the sub-2825.00 zone (2822.75 secondary intraday low).
Right now, we don't know if this is a retest of the overnight low at 2820.50, or if it is a resumption of the near term dominant downtrend off of the 8/07 high at 2863.50?
In any case, for the rest of the session, we have well demarcated range to watch that will help us determine if ES is putting in a near term bottom, or is on the verge of slicing beneath important support: 2840/43 on the high side versus 2823/20 on the low side... Last is 2824.50
I think I will remain in my counter trend long position in SPXS at 23.33 for a while longer, just in case (last is 23.59/60)

