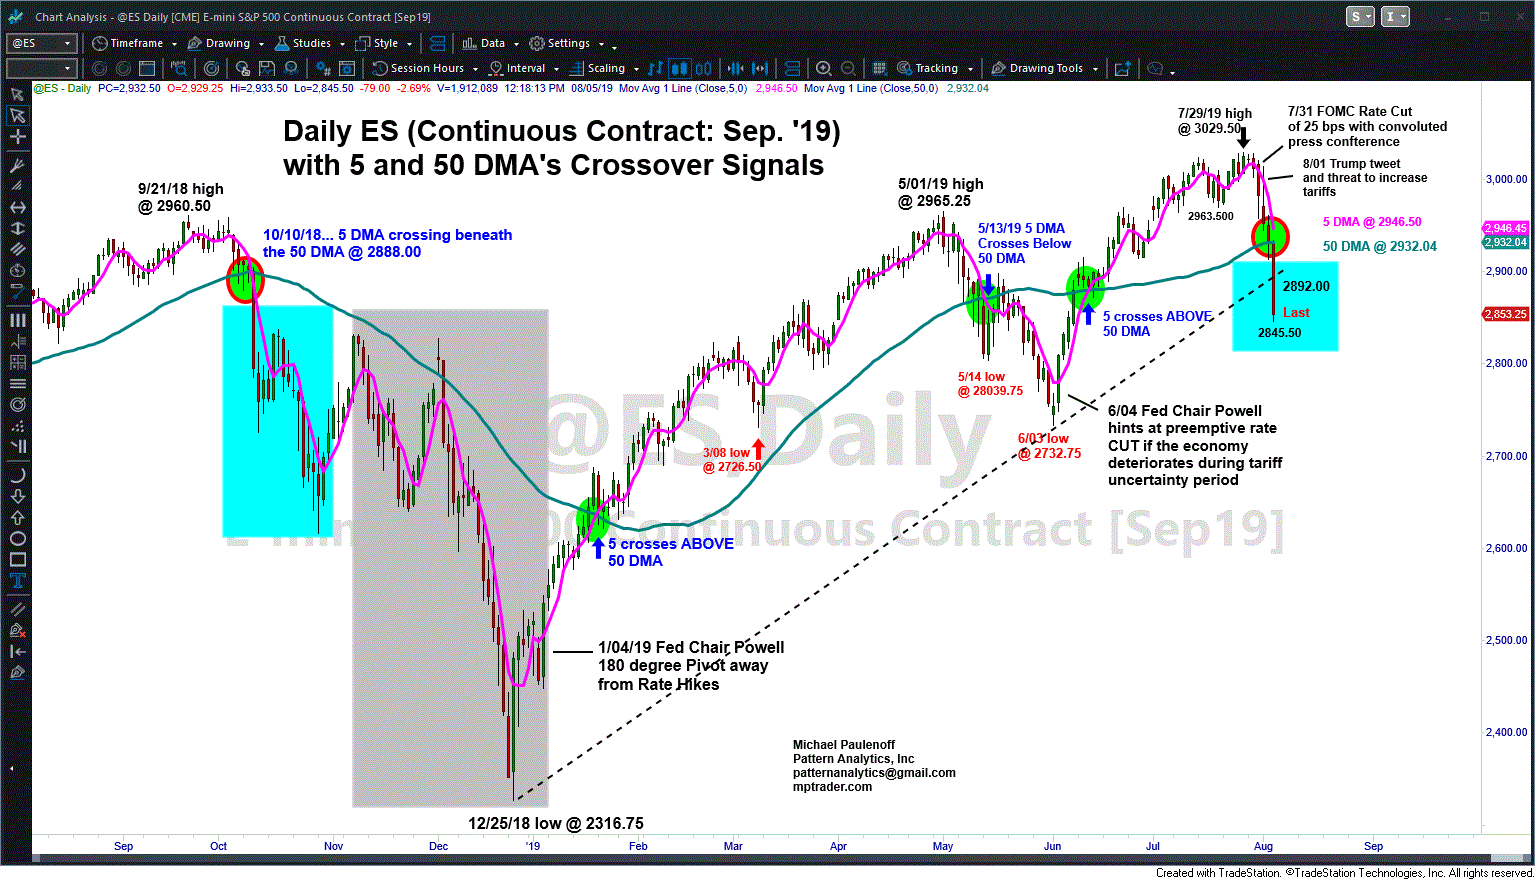
ES 5 DMA About to Cross Beneath the 50 DMA, Which Has Been a Major Corrective Signal. Will This Time be Different?
Last Friday in my 12:41 PM ET post, we discussed my Big Picture ES Daily Chart with the 5 and 50 Day Moving Averages. Here was one of my observations:
The differential between the two MA's is 48.5 points, with ES pressing on the 50 DMA. The longer ES remains under 2950, the faster differential will narrow towards a negative crossover.
Fast-forward to right now, we see on my updated chart that the 5 DMA is sloping sharply to the downside at 2946.15, juxtaposed against a flattening slope of the 50 DMA, now at 2932.01. The differential between the sharply declining 5 DMA and the horizontal 50 DMA is now just 14.14 points (and narrowing).
Barring a Trump tweet that he and President Xi spoke on the phone and that POTUS decided to remove all tariffs immediately as a gesture of goodwill to kick-start a new round of negotiations, the 5 DMA will cross beneath the 50 DMA at tomorrow's close, which will trigger a sell signal in this particular intermediate term chart set up.
The last time there was a negative MA crossing was on 5/13/19, which triggered a decline from 2873.25 to the 6/03 low at 2732.75, or 5%. The instance prior to that occurred on 10/10/18, which triggered a decline from 2888 to the 12/25/18 low at 2316.75, or 20%.
We don't know what magnitude sell signal might be triggered tomorrow, but our two prior instances of a negative MA crossover resulted in additional downside of at least 5% and possibly 20% from the day of the signal, which leads to an extrapolation of a minimum decline to the 2785 target zone but possibly to the all the down to revisit the Dec. 2018 low-zone at 2350-2300... Last is 2851.75...

