ES Again Levitates at its Highs, Awaiting the Jammers
 By
Mike Paulenoff
By
Mike Paulenoff
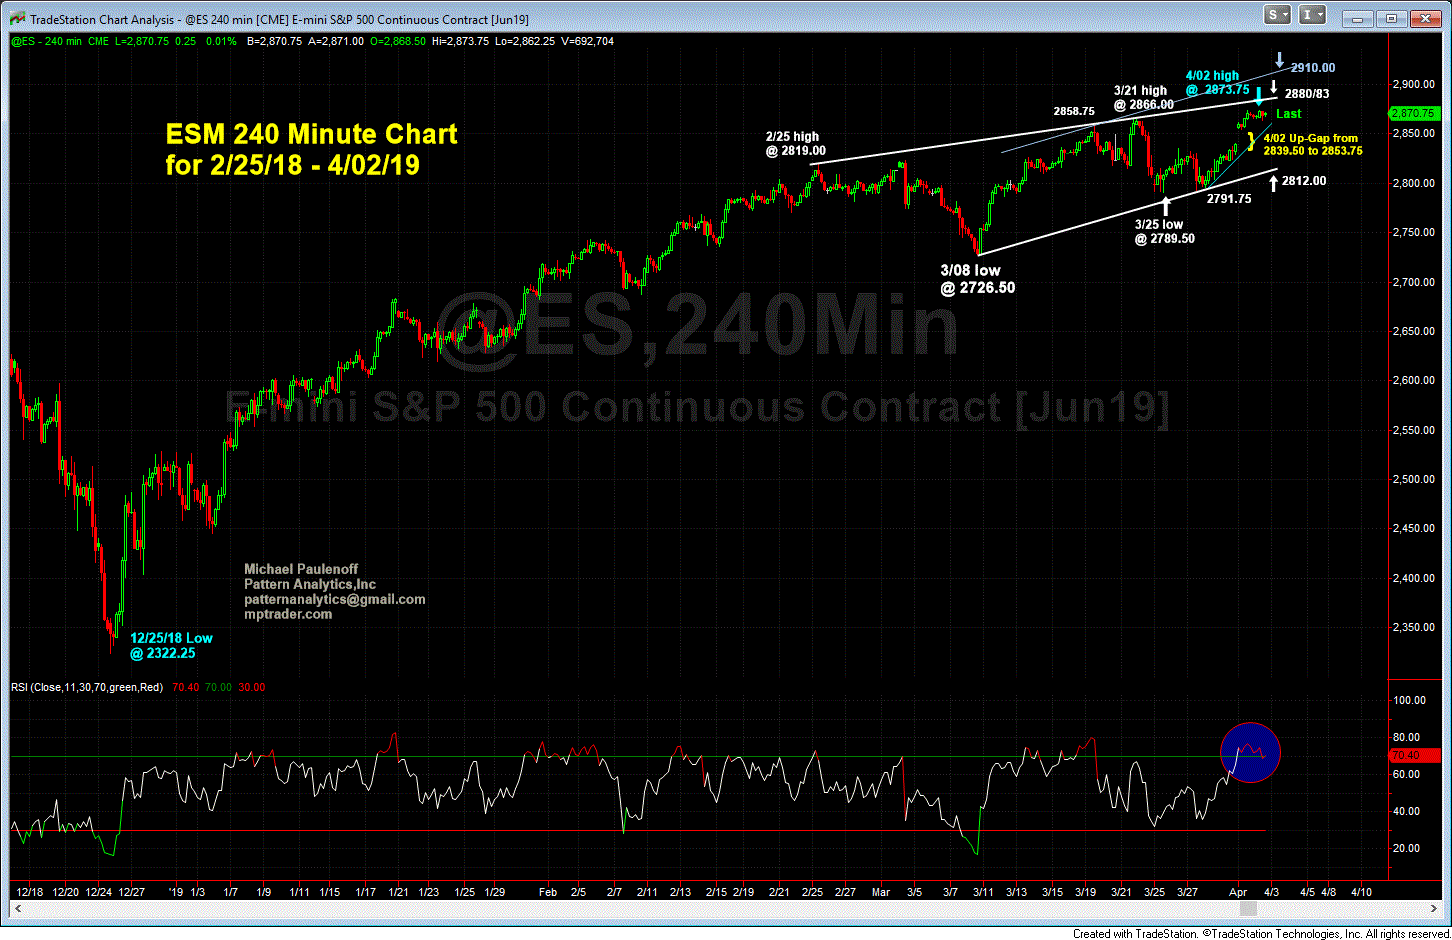
ES-- heading into the final hour of trading today, let's change timeframes to my 4 hour chart from my hourly chart to see if there are hints about what the set up in ES is telling us. The attached chart shows all of the ES action off of the 12/25/18 low.
It is interesting that although my 4 hour RSI Momentum Gauge has been in overbought territory since yesterday morning's up-gap open (2839.50 to 2853.75), and as a matter or fact, appears to be rolling over into a nearest term sell-signal (an RSI decline beneath 70 after spending several 4 hour periods above 70), price has exhibited an absence of sellers, and decreasing volatility within just 5 points of its recent high.
In other words, in the absence of a breach of today's pullback low at 2862.25, RSI is consolidating above 70, and is hinting that another upside thrust is likely that propels ES still higher, to 2880/83, and if hurdled and sustained, to 2900/10 thereafter. Last is 2871.50