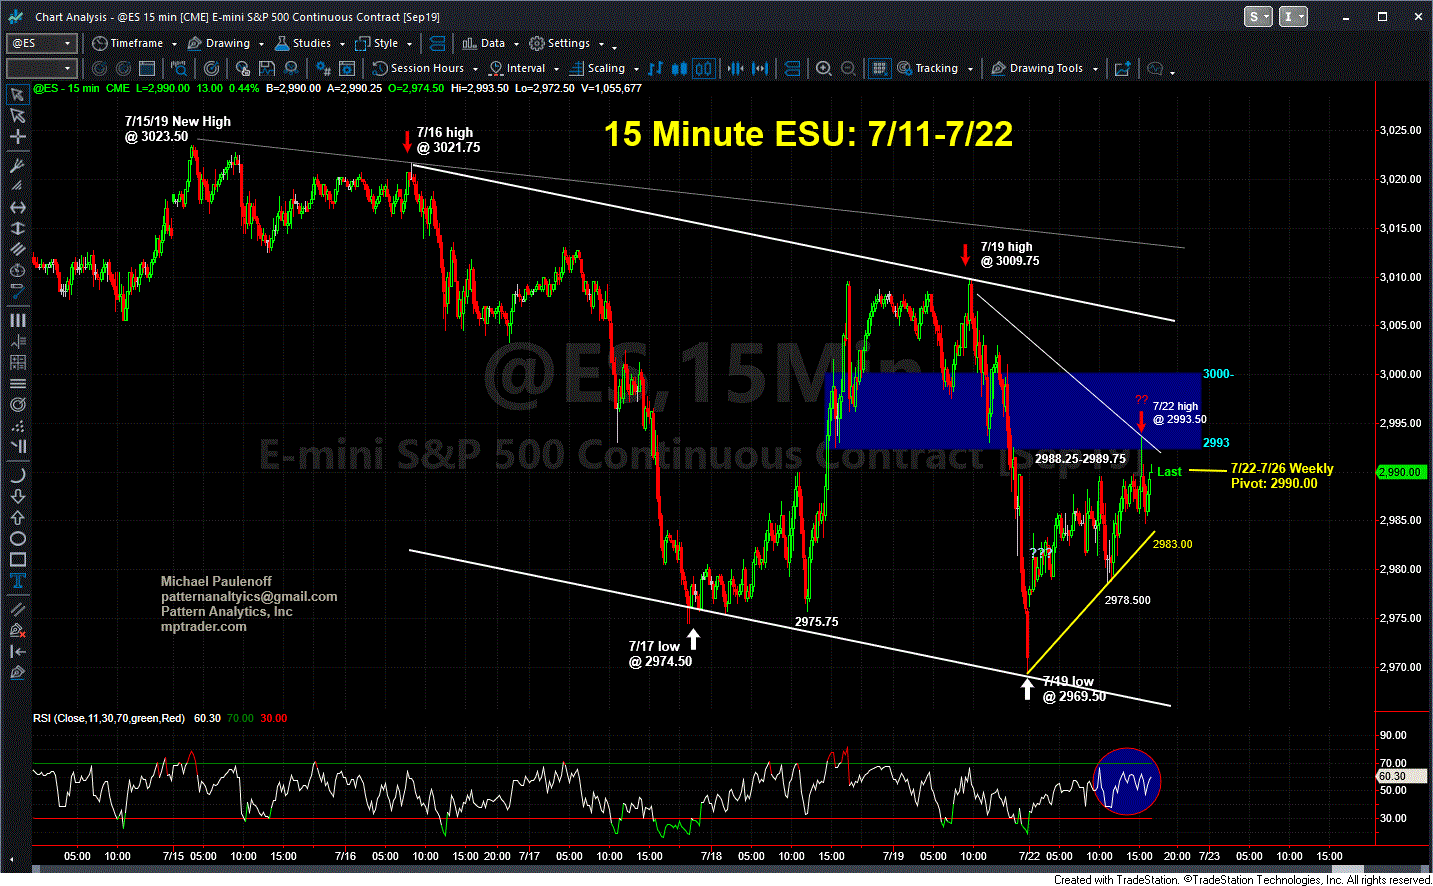
ES Has Carved-Out a One Week "Downtrend"
I had no electricity for 90 minutes today, and it really didn't matter. Lots of sideways noise in these markets awaiting the next catalyst during the dog days of summer.
My attached ES chart shows all of the intraday action since a new all time was hit at 3023.50 on 7/15/19. From a strict technical perspective, the pattern exhibits a budding series of lower-lows at 2974.50 (7/17) and at 2969.50 (7/19) juxtaposed against a series of lower-highs at 3021.75 (7/16), 3013 (7/17), 3009.75 7/19), and 2993.50 (today).
To disrupt and neutralize the budding pattern of lower-lows and lower-highs off of the 7/15 all time high at 3023.50, ES needs to climb and take out resistance between 3005 and 3010. Anything less than that effort will leave us "purists" skeptical of upside continuation.
Have a great evening everyone... Hopefully tomorrow will be a bit more eventful... ZZZZZzzzzz...

