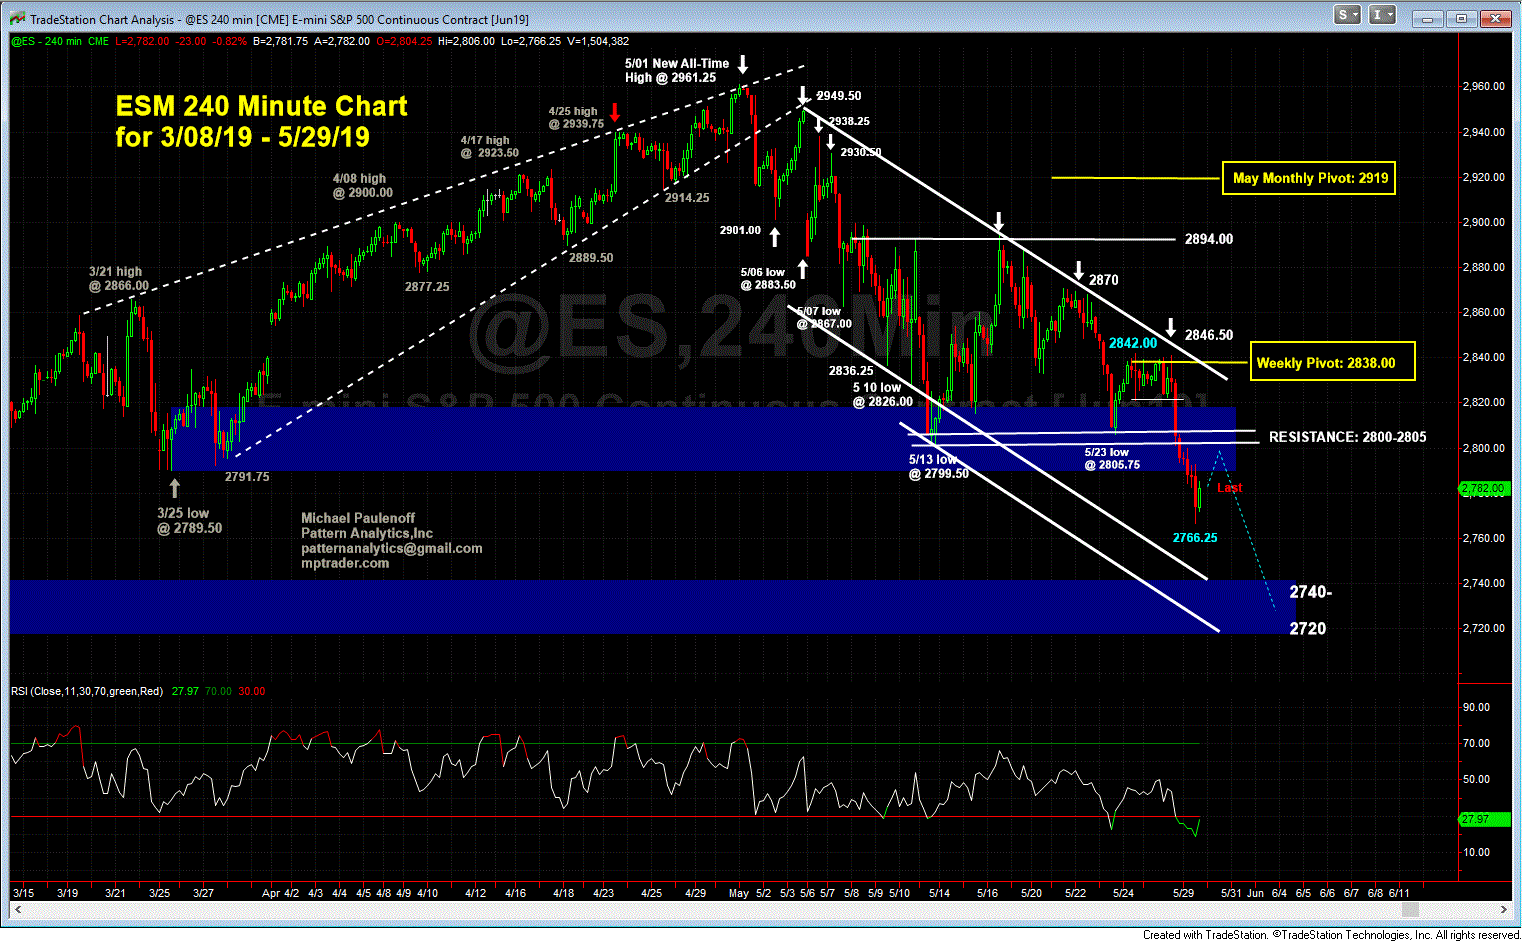
ES Remains in the Grasp of its May Down-Channel
ES heading into the final two hours of trading shows on my 4 Hour Chart that ES has bounced off of its intraday low at 2766.25 to the 2785 level, or about 20 points, the magnitude of which barely shows up on the attached chart dominated by stair step weakness that has unfolded during the month of May.
My preferred scenario calls for a bit more upside that approaches but does not penetrate key resistance at 2800/05, followed by another downleg that presses ES to new lows into the 2740 to 2730 target zone.
Only a sustained climb above 2805 into the close will morph the "bounce" off of the intraday low at 2766.25 into a more constructive near term set up... Last is 2784.75

