Emini S&P 500 Sending "Melt-Up" Technical Vibes
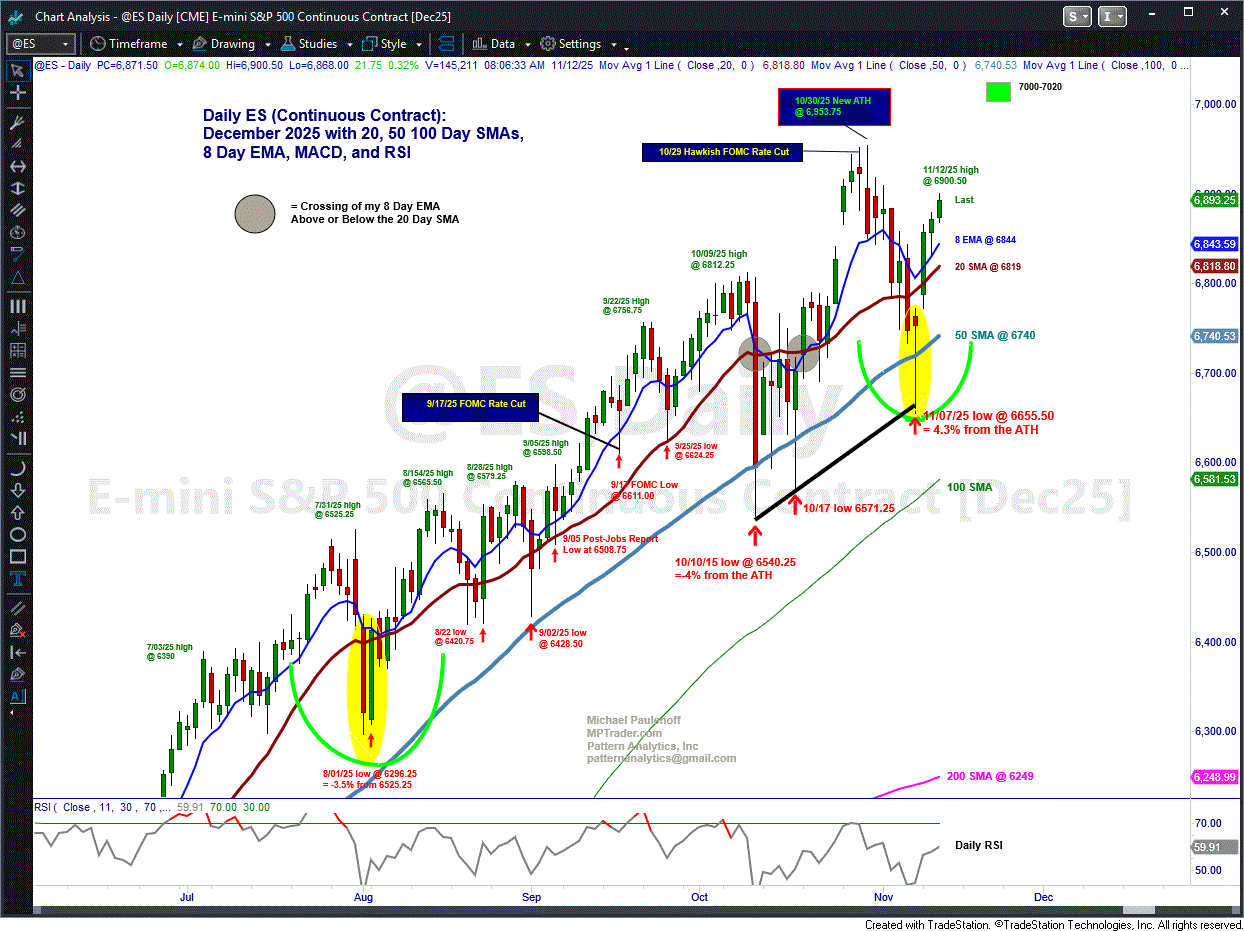
ES-- My attached Big Picture chart setup is sending me "melt-up" technical vibes. My 8 Day EMA and the 20 Day SMA have a similar juxtaposition as they did at the August 2025 low: The 8 Day EMA kissed the up-sloping 20 Day SMA, but a negative cross-under was avoided during the 3.5% to 4.3% corrections (August and November)...
After each "near MA cross-under" ES pivoted to the upside into a powerful new uptrend period.
The current upmove from last Friday's reversal low at 6655.50 to this AM's high at 6900.50 (+3.7%) has turned the MAs sharply higher to angles of ascent that in the past have generated vertical price thrusts.
I am thinking ES is poised for just such a price path during the balance of November... Last is 6893.50...

