Emini S&P 500 Still In Corrective Downtrend
 By
Mike Paulenoff
By
Mike Paulenoff
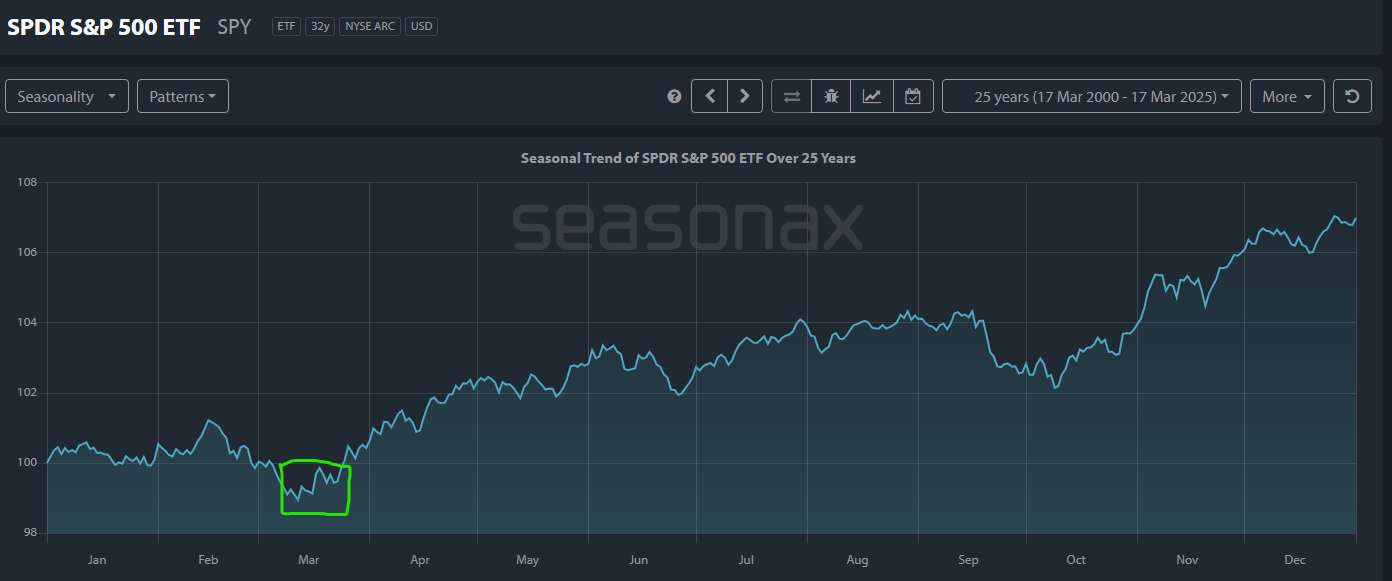
ES-- From a seasonal perspective (25 years of data), during the middle of March, ES (SPX, SPY) has exhibited a very strong track record of turning up into a multi-month period of strength (See seasonal chart below).
On March 13th-- right on its seasonal schedule-- ES hit a 10.8% multi-month corrective low at 5561.50 and has since rallied 2.6% to yest's high at 5755.75.
However, my attached 4-Hour ES Chart shows that the recovery rally so far has failed to inflict meaningful technical damage to the dominant corrective downtrend pattern. To do so, ES needs to pivot to the upside again, into a thrust above consequential resistance lodged between 5800 and 5860 that will trigger upside reversal signals in my work that project a pathway higher toward 6000-6040.
At the moment, my pattern and momentum work off of the 3/13/25 low at 5561.50, regards recent strength as a counter-trend rally that, in the absence of another upleg into and through 5800-5860, is vulnerable to another loop down to retest and likely violated 5561.50 en route to my optimal lower target window of 5425 to 5450...
For today's session, I will be watching intraday support at 5688, which if violated and sustained, increases the likelihood of downside continuation that retraces a much larger percentage of the recent rally from 5561.50 to 5755.75... Last is 5703.75...