Emini S&P 500 and 10-Year Yield Reaction to PPI and Jobs Data
 By
Mike Paulenoff
By
Mike Paulenoff
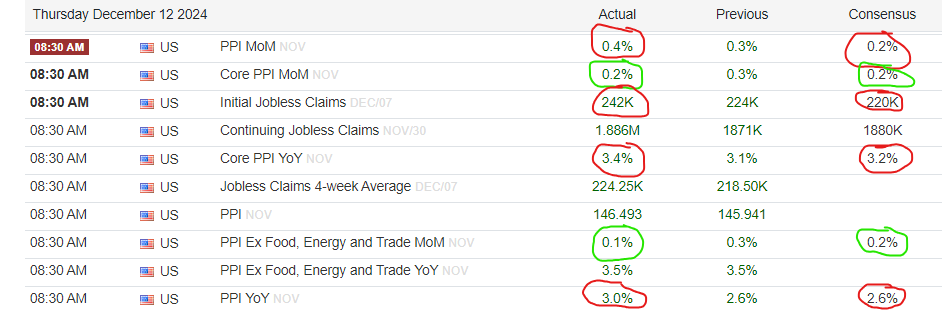
Well now, PPI came in hotter-than-expected for November (see data table below my charts), but Weekly Jobless Claims came in much higher-than-expected (the labor market is weakening). Which data point matters more? Apparently, the Jobs data because the probability of a rate CUT next week has increased to 98% from 75%!!!
The reaction of the equity and bond markets to the news is muted so far.
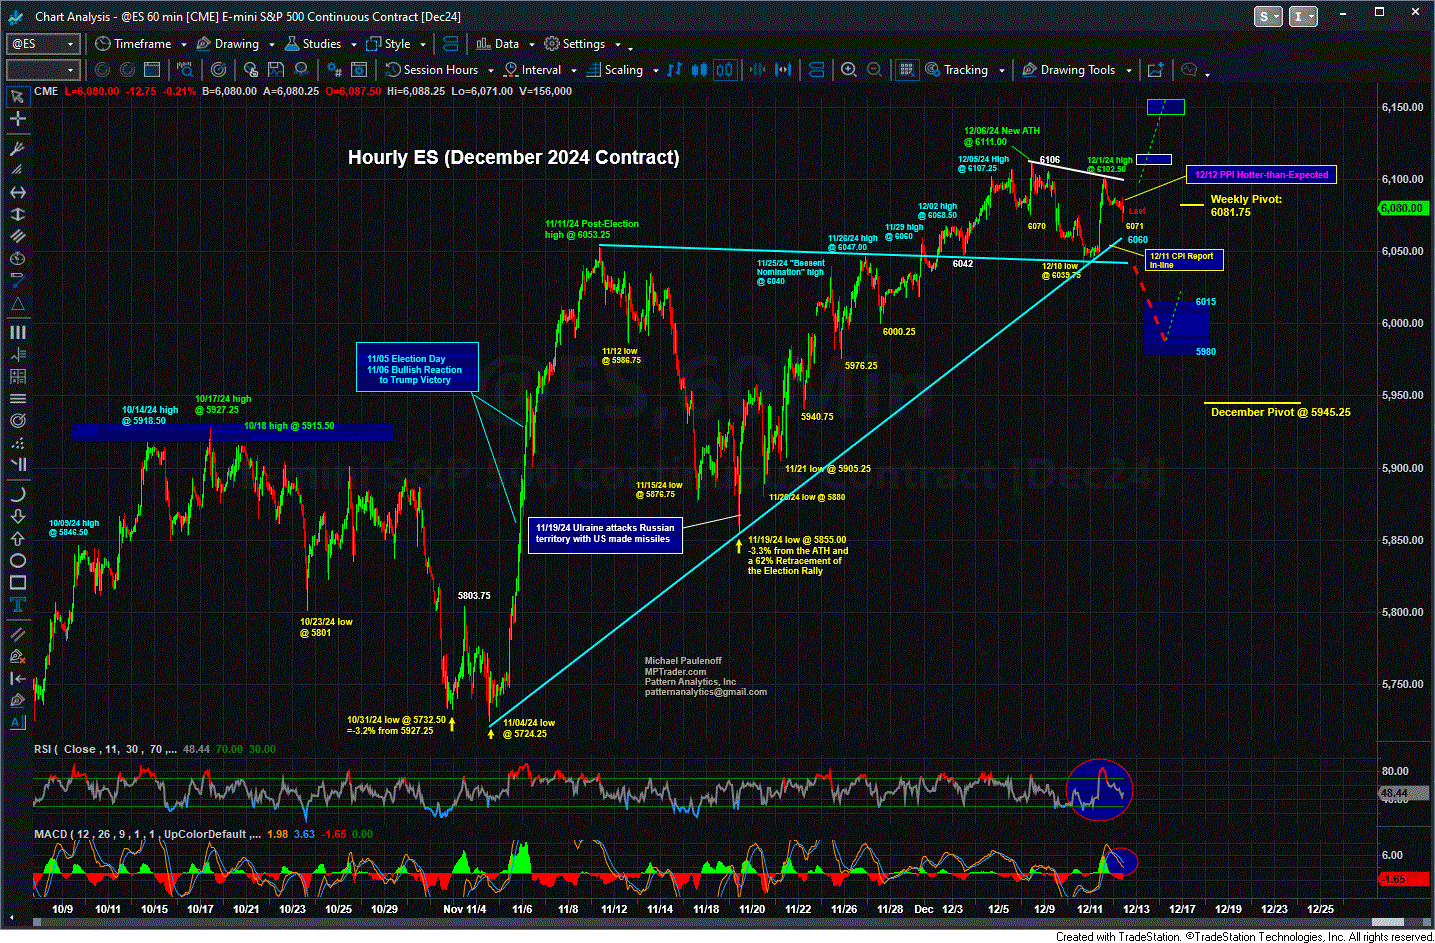
Surprisingly, ES is down just 0.25% at 6078.50. Unless and until ES presses beneath key support lodged from 6060 down through 6040, my pattern work continues to argue for upside continuation that challenges and hurdles resistance from 6102.50 to the ATH at 6111, in route to 6140/60 next (see my attached Hourly Chart)... Last is 6079.50...
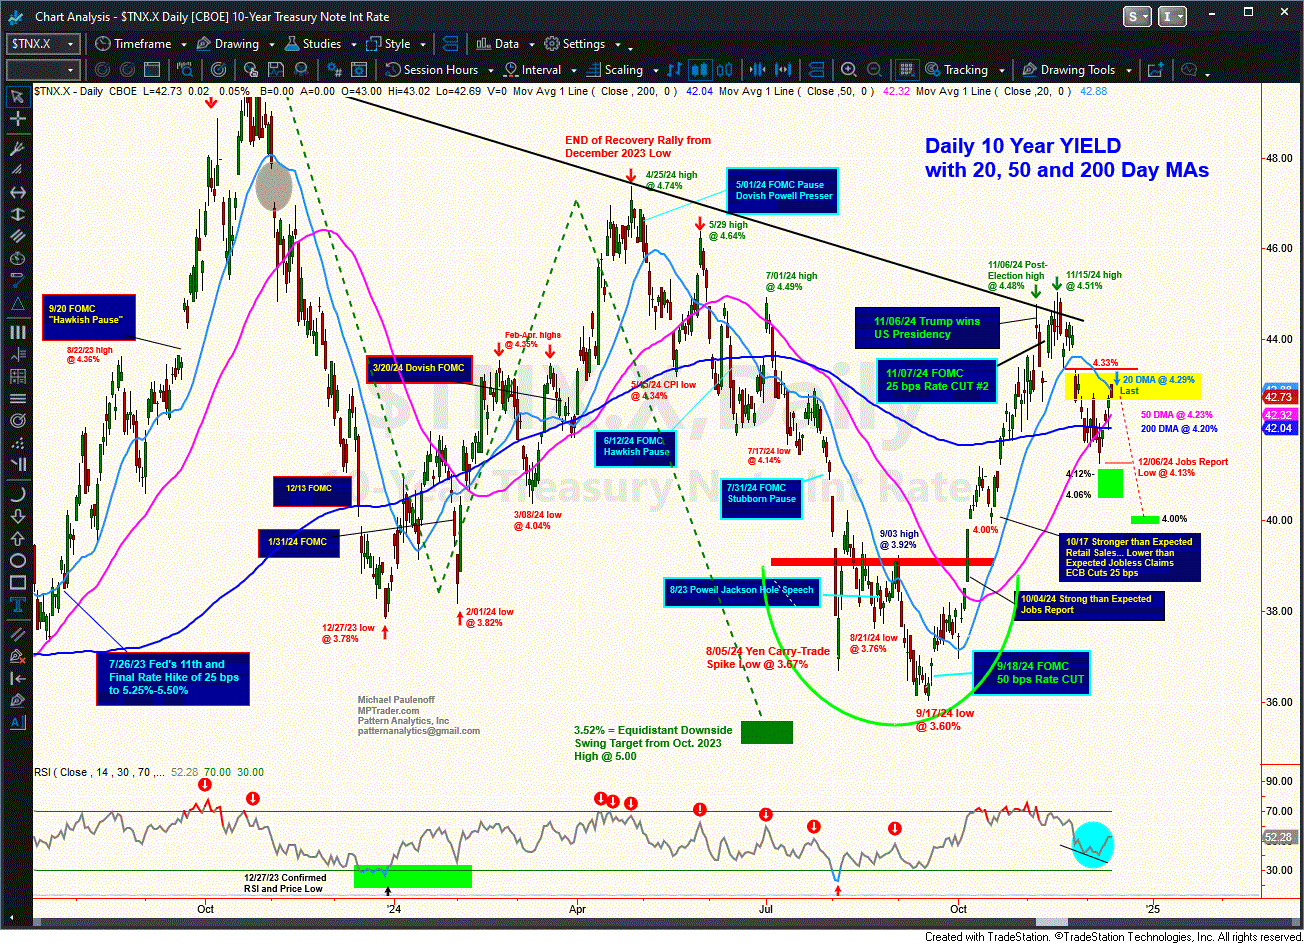
As for 10-year YIELD, curiously it failed to react to the upside after PPI, and instead has down-ticked to 4.27% from 4.30%, perhaps because of the higher Claims figure. Be that as it may, so far YIELD has been repelled by the sharply down-sloping 20 DMA (see my attached Daily YIELD chart), and as such, my preferred scenario pointing closer to 4% ahead of the next major YIELD upleg remains intact... last is 4.27%...