Entering Historically Positive Seasonal Period
Good Tuesday Morning, MPTraders! October 21, 2025-- Pre-Market Update:
-- 11 Calendar Days until November 1st, which is President Trump's deadline for imposition an additional 100% tariff on Chinese imports if no progress is made on the trade negotiations. The threat notwithstanding, POTUS and Chinese President Xi are supposed to meet next week before the Nov. 1st deadline...
-- At 3 PM ET, Treasury Secretary Bessent gives a speech that may inform us about the Administration's current thinking and playbook in its trade talks with China...
-- Today is day #21 of the Government shutdown...
-- NFLX reports Earnings after today's close...
-- On the runway: Friday, we get the latest CPI Inflation Data for September, and the University of Michigan 1 and 5 year Inflation Expectations...
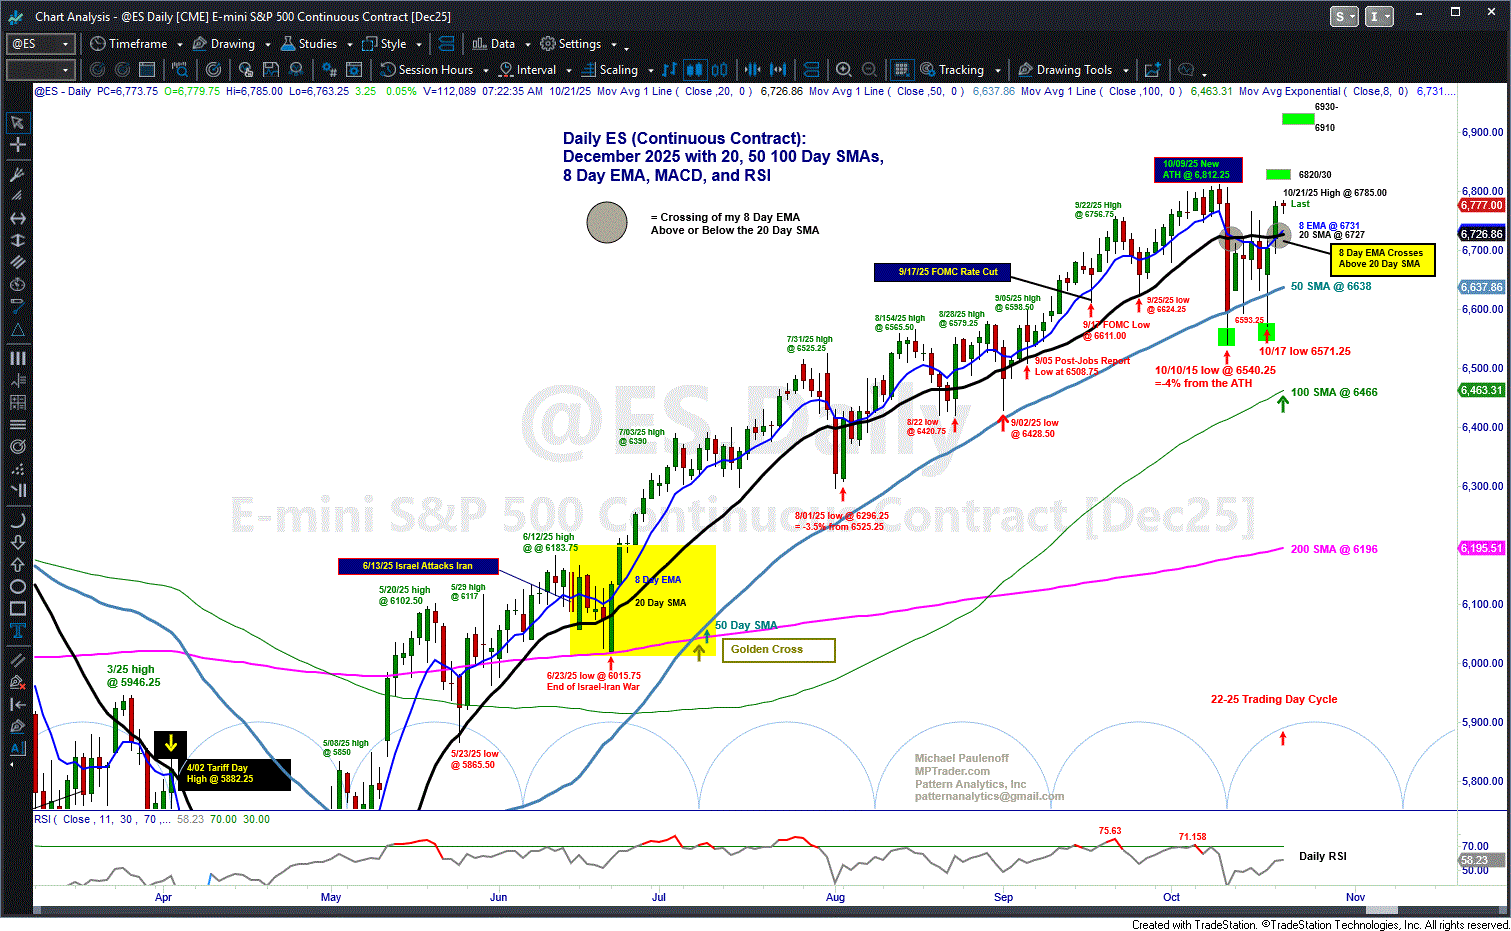
As for the markets, ES has flipped from down 10 points to up 2-4 points in pre-market trading after yesterday's strong up-day. My attached Big Picture Daily Chart shows that ES closed above the 20 DMA yesterday, and remains about 50 points above it this AM.
Furthermore, my 8 Day EMA has crossed ABOVE the 20 Day SMA for the first time since April 25th, which occurred just off the April 2025 low that initiated the 38% advance into the October 2025 high. The intervening negative 8 x 20 Day MA cross-under (near-term sell signal) lasted only 7 trading sessions (from 10/10/25 to 10/20/25), during which time the correction depth hit 4%... Continued below the Daily ES Chart...
Although it is unlikely that the current positive crossover of the 8 Day EMA with the 20 Day SMA will mirror the power and longevity of the April 2025-October 2025 advance, we are entering a historically positive seasonal period.
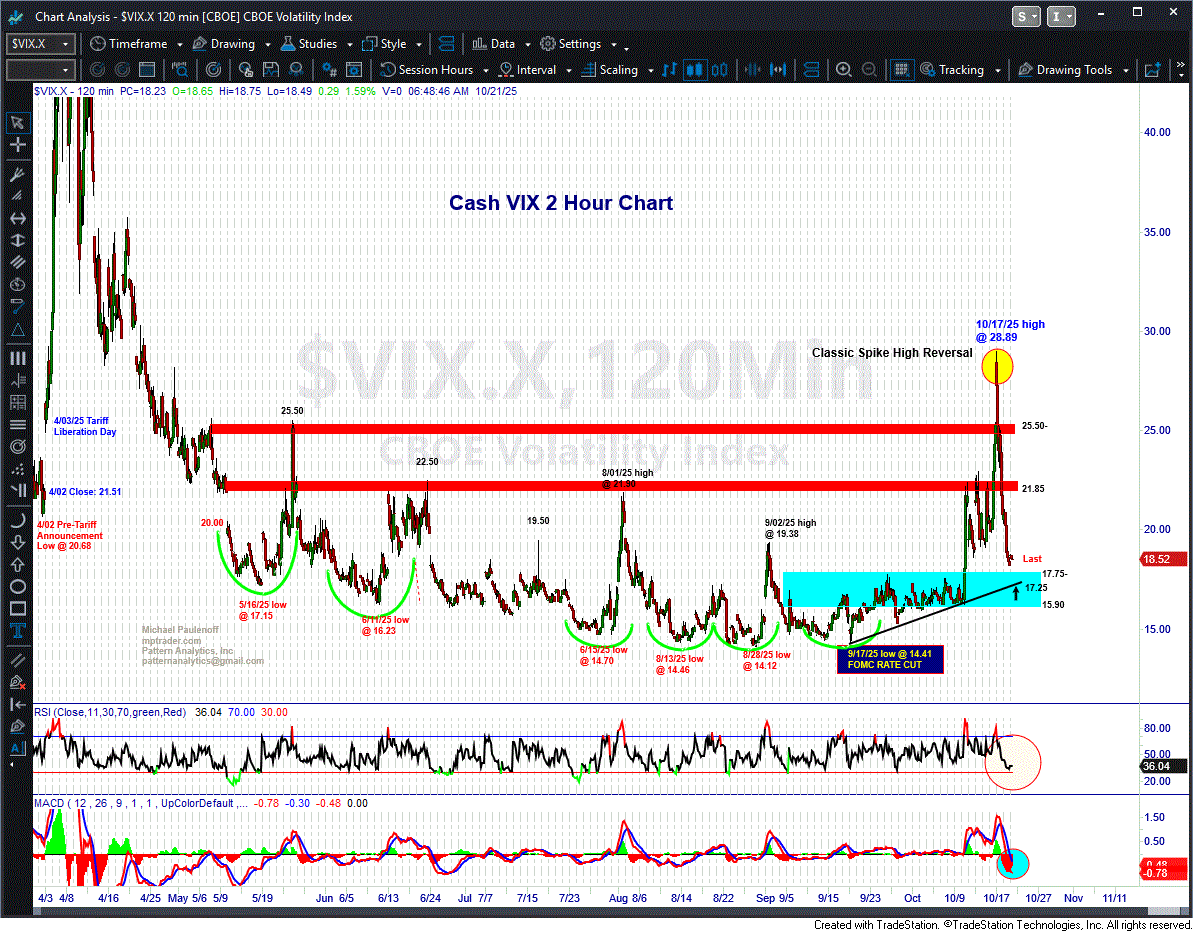
Add to the positive seasonal, an intriguing VIX graphic (also see my attached VIX chart below) from Ryan Detrick (Carson Group), who explains:
VIX nearly hit 29 on Friday, yet S&P 500 was near ATHs. Previous times we saw anything like this kicked off huge melt-ups in the late '90s and '20/'21. Yes, eventually we saw this signal mark the peak, but the first signal in previous clusters saw very strong future returns...
The ES spike lows on 10/10 at 6540.25 and last Friday's (10/17) spike low at 6571.25 have the right look of a corrective Double Bottom followed by the initiation of a new upleg that my pattern work projects into new ATH territory at 6820/30 and then to 6910/30. Based on Detrick's table, if the median 1-month and 3-month returns following a VIX spike-reversal at 29 or higher mimic previous similar data points, then ES already has satisfied the 1-month return (+3.2% from the 10/17/25 spike low at 6571.25), with the 3-month, 8.2% median return projecting ES into the 7100 target zone by mid-January...
Food for thought heading into the post-October seasonally bullish timeframe...


