Eye on EW - Market Analysis for Jul 20th, 2020
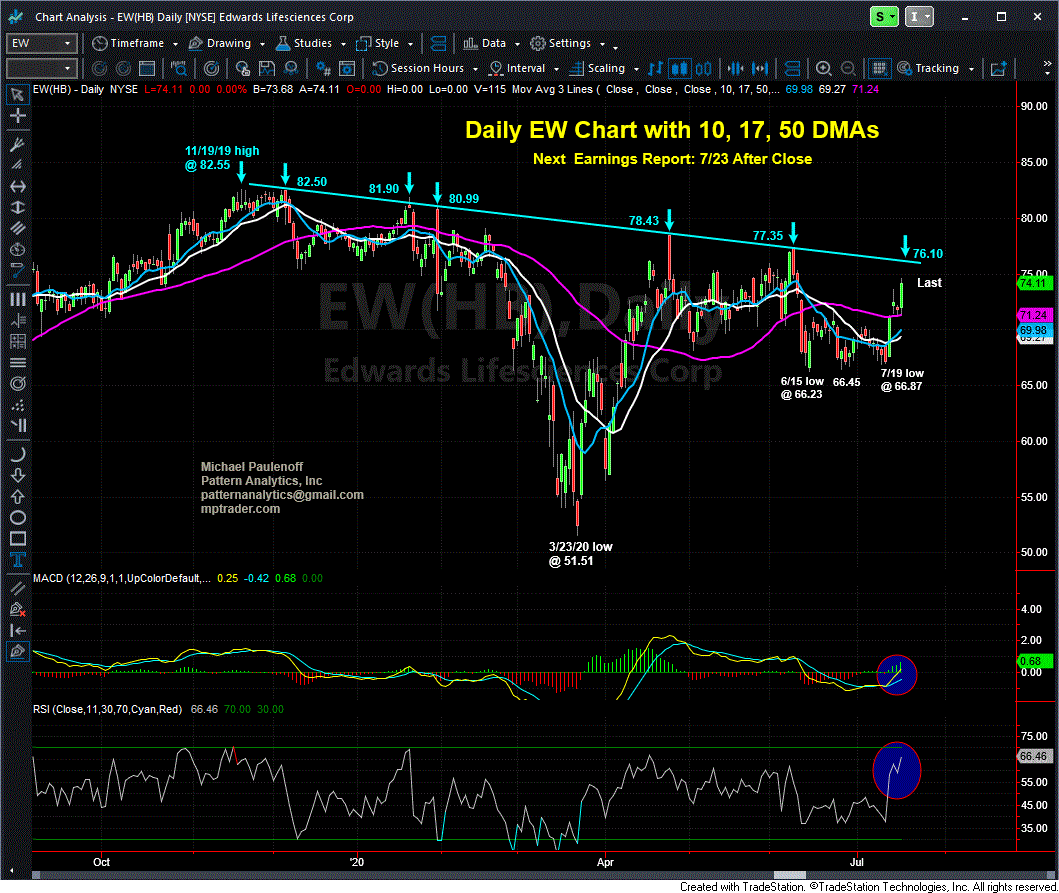
A chart set up that popped out at me over my weekend work: EW (Edwards Lifesciences Corp), a company that develops and manufactures heart valves. My attached Daily Chart shows that since last November, EW has undergone a sharp correction from 82.55 (11/19/19) to 51.51 (3/23/20), and then from the March low has carved out a pattern that exhibits bullish form, and is putting upward pressure on an 8 month resistance line that if hurdled and sustained, will trigger targets of 100 to 110.
Let's also notice that last Wed., Thurs., Friday EW traded above all of my "trading MA's" (10, 17, and 50 DMAs), which is a very positive technical sign, and strengthens its near term set up.
As fate would have it, EW earnings are scheduled for Thursday 7/23 after the close, and could very well provide the next directional catalyst. If the current chart set up is whispering to us about a directional outcome ahead of or in reaction to earnings, the message is HIGHER. Trading earnings always is a crap-shoot, so as always, be prudent, consider options, size positions accordingly to "avoid the risk of ruin."

