Eye on TSLA Support
Back on 10/09, when TSLA was trading at 342.77/99, we discussed the following:
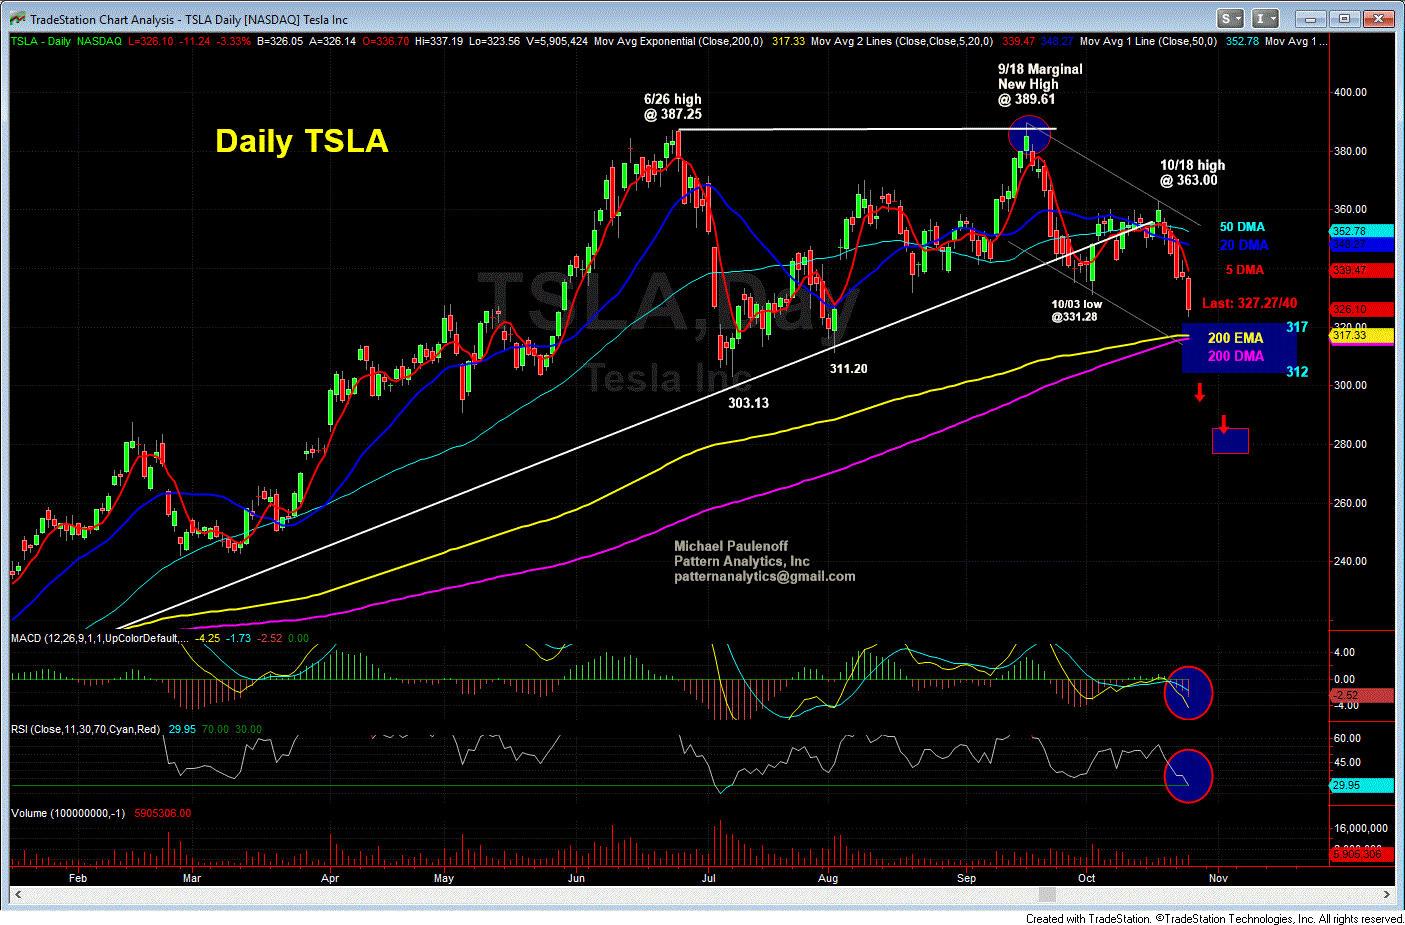
Today's weakness in TSLA has the right look of a breakdown after a recovery rally bounce within a larger, incomplete intermediate term corrective process that points to a press into the area of both the 200 DMA and the 200 Day EMA, in the vicinity of 309 to 314. As long as TSLA remains below last Friday's recovery rally high at 360.10, my preferred scenario points to a run at the low 300 target zone.
Forward fast to today, and we see TSLA has generally followed my preferred price path towards a challenge of it rising 200 DMA and 200 EMA, both in the vicinity of 316-317. TSLA weakness must be contained in the 317-312 target zone to avert downside continuation towards 285-280

