
GLD vs NUGT - Market Analysis for Mar 7th, 2018
 By
Mike Paulenoff
By
Mike Paulenoff
NUGT exhibits a very messy pattern near term (see hourly chart attached), and needs to climb above 25.00-26.00 to get any upside traction. Otherwise, NUGT will remain in an attempted bottoming zone between 21.50 and 25.50.
Meanwhile, the second chart attached compares the daily patterns of GLD and NUGT, which clearly shows a positive trend for GLD contrasted by the negative trend for NUGT. If GLD claws its way above 128-129, then NUGT should hurdle 25.50-26.00, as the two related products begin to move in tandem.
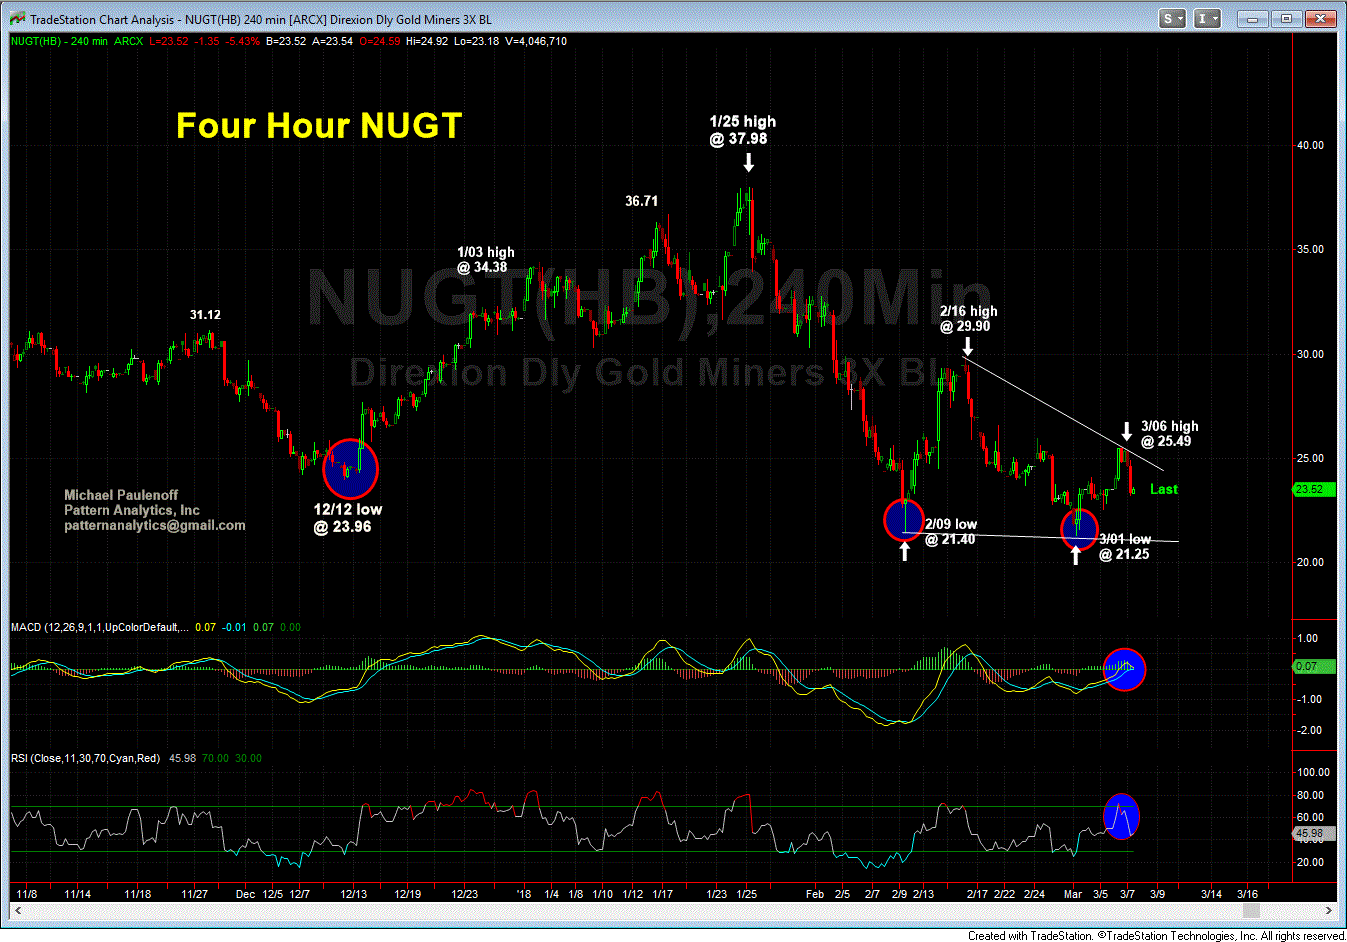
3 07 18 NUGT 1225 GIF
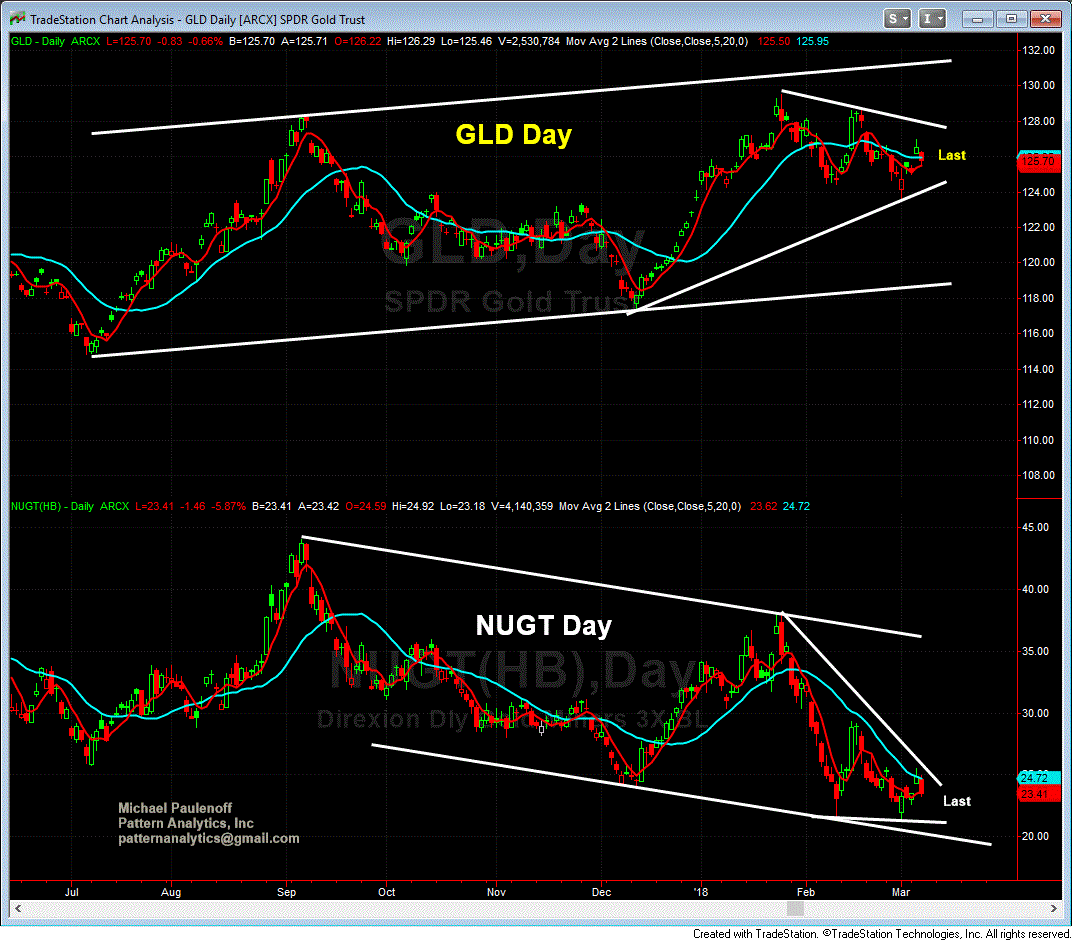
3 07 08 GLD v. NUGT GIF