HD Rolls Over Hard in Reaction to Better Than Expected Earnings
Below is what we discussed about HD just before 9 AM ET, after this morning's 6 AM ET earnings report:
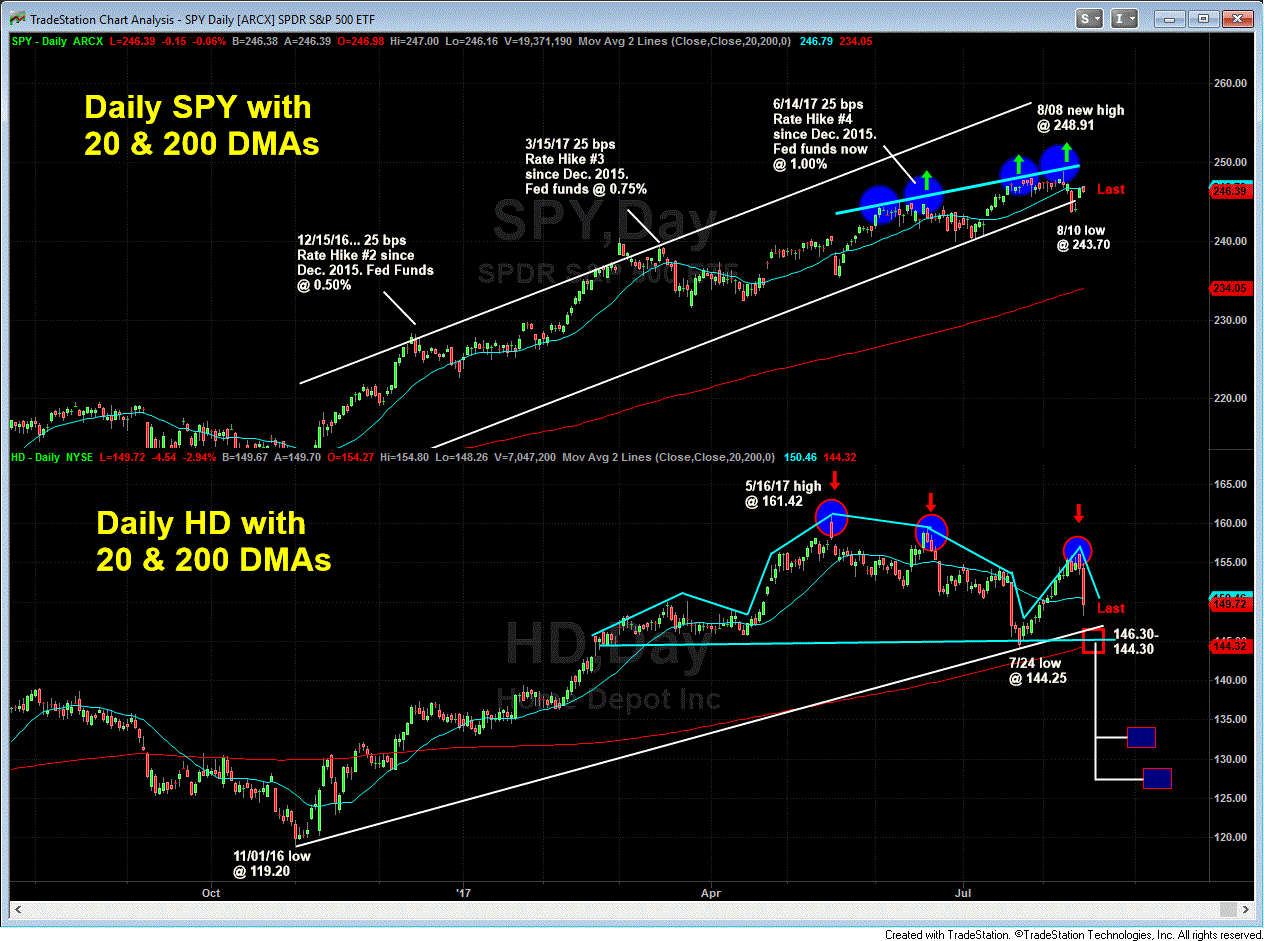
Home Depot (HD) beat on EPS, Revenues, and Same Store Sales. However, after initially popping 2.5% to 158.11 from yest.'s 154.26, HD has reversed sharply into negative territory at 153.00/10 in pre-market action. I am not sure what the selling is all about, except for a "sell-the-news" reaction, but one look at my 4 hour chart of HD, we can see that HD actually peaked back in mid-May, and since has established a series of lower-highs (including this AM's spike to another lower-high). From a near term perspective, HD needs to hold support in the 152.40/60 area to avert triggering a potentially significant sell signal from one of a handful of powerful, still relevant and profitable, brick and mortar retailers. Also attached below is a big picture comparison chart of the SPY vs. HD, which illuminates the glaring price divergence between the two names. The glaring under-performance of HD certainly is a drag on the underlying indices like SPY, but also could be a reflection of the health of the consumer (notwithstanding this AM's strong Retail Sales Report for July), or perhaps some fatigue in the home improvement sector. All I know is that the pictures of HD and its post-EPS price action are a warning signal about something either macro in scope or indigenous to the company's future growth prospects.
During the ensuing 3 hours since our initial post, HD has sliced still-lower to an intraday low at 148.26 so far, which has violated important near term support at 152.40/60 as well as the 20 DMA, now at 150.47 in what increasingly appears to be a developing multi-month top formation on Home Depot that is putting immense price pressure on critical support lodged between 146.30 (the Nov. 2016-Aug. 2017 support line) and the most recent meaningful pullback low at 144.25 (7/24/17. Purely from a technical perspective, any forthcoming weakness must be contained above 144.25 to avert triggering downside potential that projects to 134-132, and possibly to 130-125 thereafter (see attached updated SPY vs. HD Comparison Chart. MJP

