Headwind of Fib Resistance Versus Tailwind of Fed-Speak: Which Will Win Out This Week?
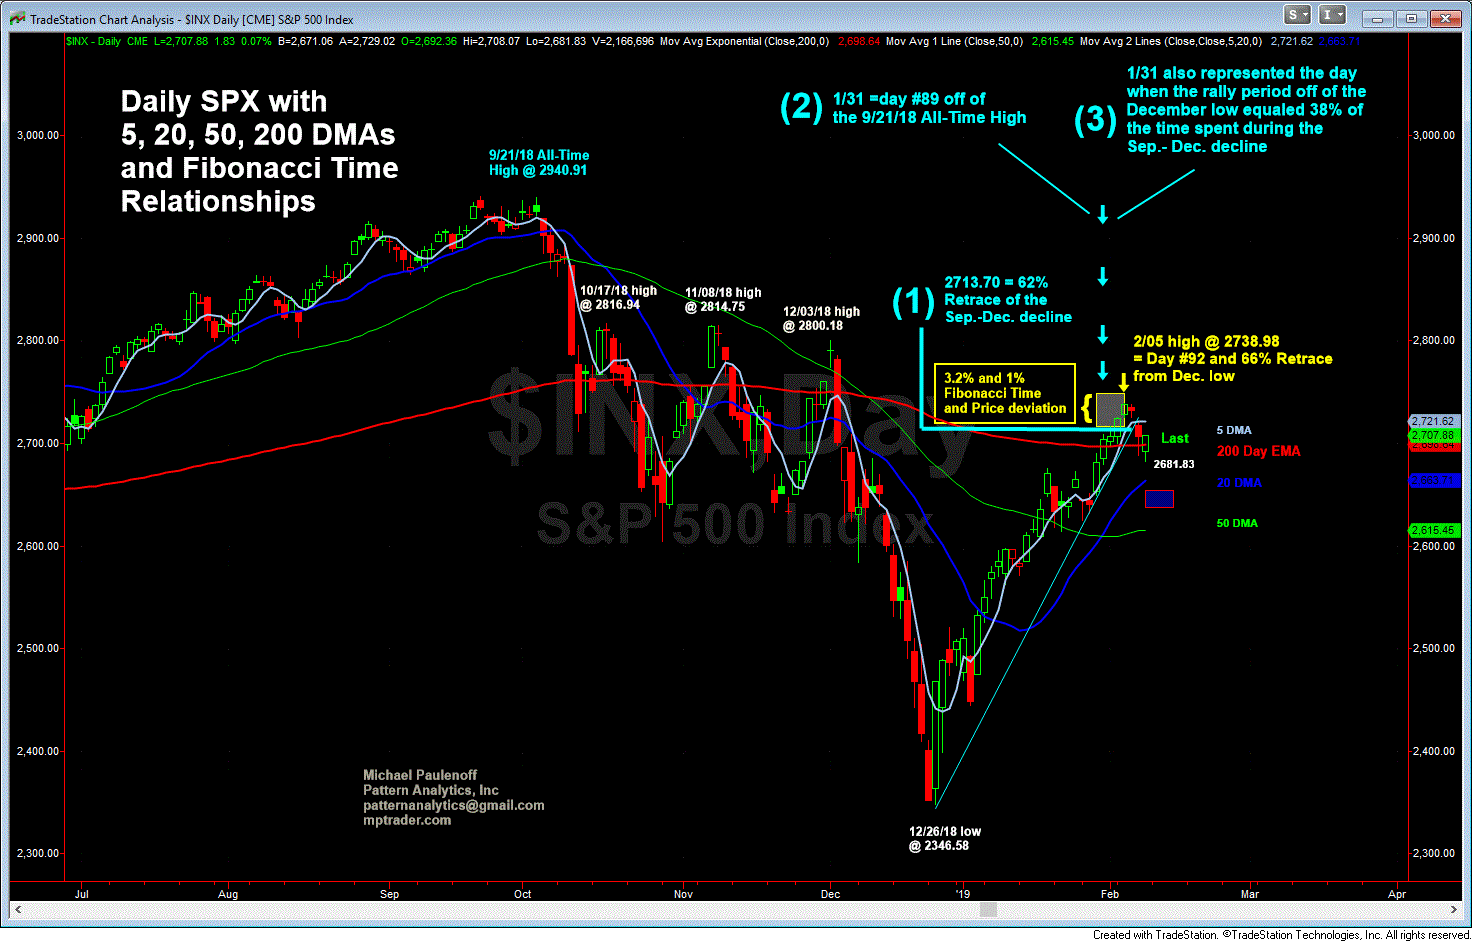
In last weekend's article, we focused on the relentlessly advancing S&P 500 (SPX) from its December 26 low at 2346.58 into an important Fibonacci price and time resistance zone at 2713.70 on January 31.
The 2713.70 level represented a 62% SPX recovery of the entire September-December decline, while January 31 represented day number 89 since the September 2018 all-time high, and the day that the December-January recovery rally time period equaled 38% of the overarching total timeframe from the September high.
We discussed the likelihood that the confluence of such meaningful Fibonacci price and time relationships could and should stall or reverse the relentless SPX six-week advance, and as such, would be a yellow caution flag for the bulls.
With the foregoing in mind, we see on our first chart that on Monday and Tuesday of last week the SPX overshot the Fibonacci parameters by 28 points (1%) during two sessions (3.2%). But then the index reversed into a 57-point correction, spending the remaining three days of last week beneath the key 62% recovery retracement level of 2713.70. SPX closed last week’s trading at 2707.88.
 Although Fibonacci relationships are precise, market reactions to them are much more often than not inexact, allowing for some minor deviation from (both above and beneath) time and price projections. To me, a 1% price overshoot, coupled with a 3-day time deviation over an 89-day period prior to an adverse price reaction indicates that, indeed, the 2713.70 level, plus or minus 1%, places SPX in the window of upside risk where it remains ahead of Monday’s opening bell.
In other words, the influence of Fibonacci time and price headwinds sweeping across the cash SPX in the 2713 to 2739 resistance zone remains in effect for the coming week. As long as this is the case, the SPX will be vulnerable to another bout of weakness within an incomplete correction that projects beneath last week’s low at 2681.83 into the 2640/60 target zone. Conversely, a sustained climb above 2739 will invalidate the Fibonacci resistance zone and point SPX to 2800/20 immediately thereafter.
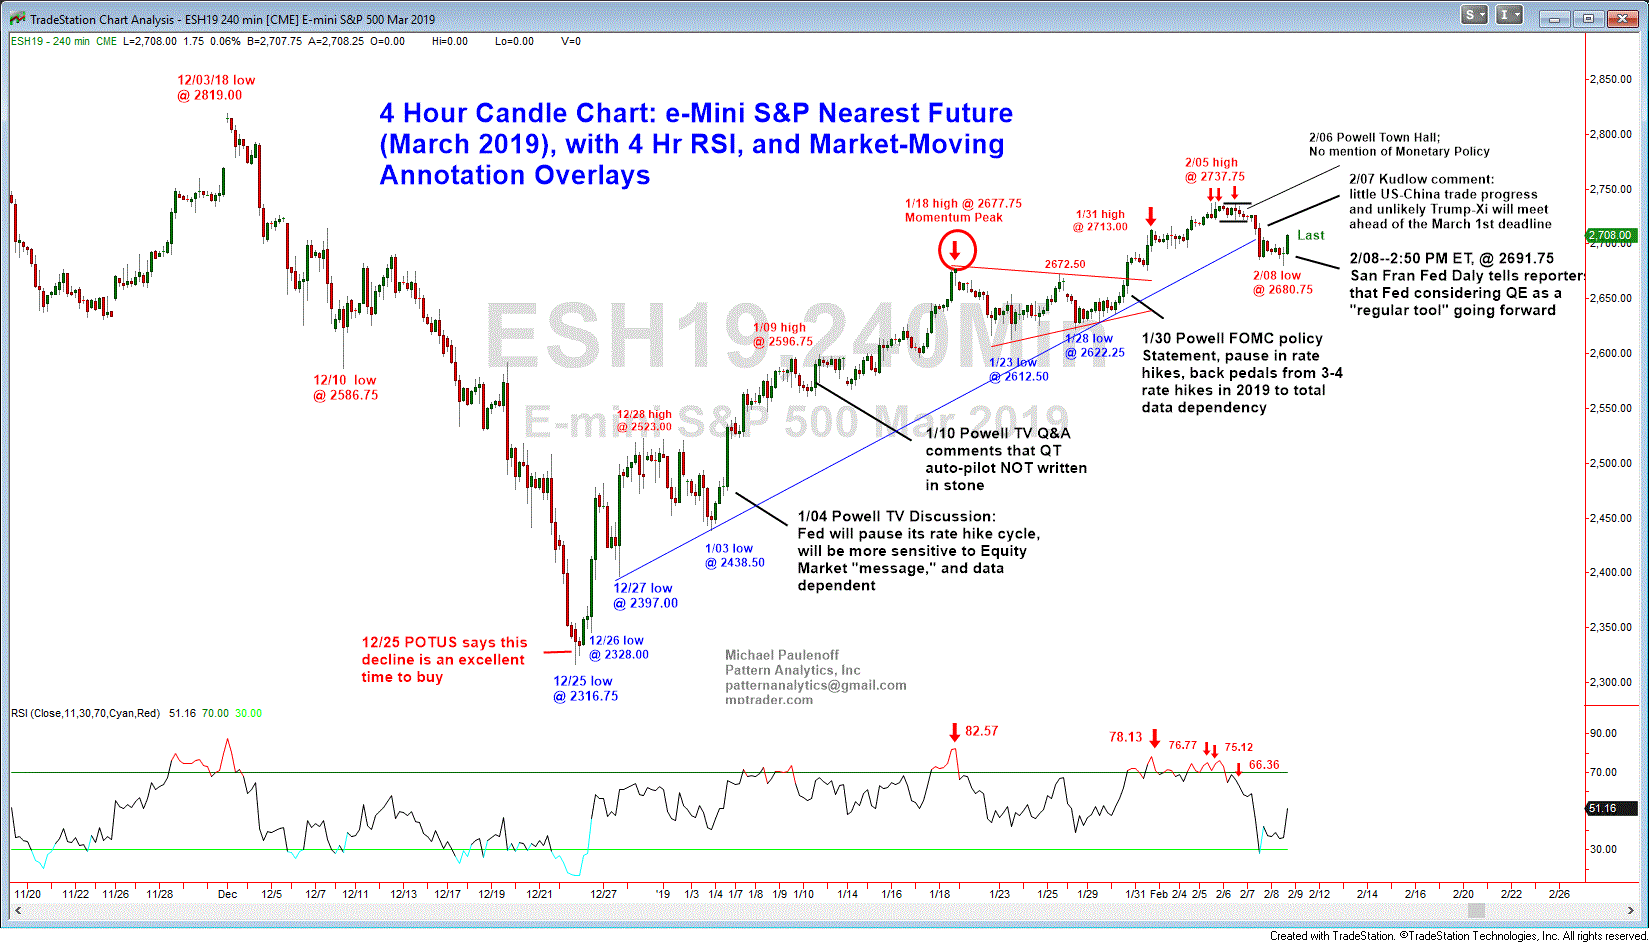
While Mr. Fibonacci is exerting market headwinds, there are also strong tailwinds that could continue to influence upside price action this coming week. Most notably is the influence of easy money Fed-speak, which has continually provided fuel for market bulls since early January. My annotated chart of the e-mini March S&P futures (ES) shows the three dates in January (4th, 10th, and 30th) that corresponded to price levels from where ES launched to the upside. When we view the dates of Fed Chair Powell’s increasingly dovish televised comments about future interest rate policy in conjunction with strong ES upside price action, it is impossible for me to dismiss it as coincidental.
 It is equally difficult for me to dismiss as coincidental Friday’s last hour upside thrust in ES from 2696 to 2708.75 immediately after Reuters and other news services ran comments from San Francisco Fed Head Daly that Fed members are considering adding Quantitative Easing (Treasury bond and mortgage purchases) to the Fed’s regular "tool kit."
From 2009 until late 2017, QE was considered an emergency program to inject liquidity into the banking system to prevent a worsening financial crisis. Perhaps going forward, it will be elevated from an experimental crisis prevention tool to something that could be invoked along with interest rate cuts during the next economic contraction? With Fed funds raised from 0% to just 2.25% over a three-year period (2015-2018), when the economy rolls over into recession again, cutting the Fed funds rate from such a shallow level could prove relatively ineffective, requiring "QE 4." It seems apparent that the Fed is preparing investors for a new, expanded recession-fighting tool kit, for better or worse, regardless of exacerbating market distortions and malinvestments.
Be that as it may, I cannot help but view the ES price action (per the second chart) during 2019 as a period of Fed easy money innuendo and jawboning for the purpose of underpinning the equity markets. Put more bluntly, the easy money comments annotated on the attached ES chart represent blatant market manipulation efforts.
Let’s also realize that while Powell’s interest rate back pedaling commentary has succeeded in lifting the averages 17% in 6 weeks, the Fed has not actually reversed monetary policy, but instead has paused in its rate hike cycle, and is still removing $40 billion to $50 billion per month per the Fed’s Quantitative Tapering program (QT). In other words, the Fed is all talk. But apparently, that is all the Central Bank needs to do to trigger relentless, near-panic periods of buying. If and whether this jawboning phase loses it efficacy or runs into diminishing returns remains to be seen.
This week, any of the Fed Heads that take to the airwaves could create another swoosh of tailwind that propels ES and SPX higher to challenge Fibonacci resistance at 2713 to 2739.
In the absence of additional bullish Fed jawboning, the Fibonacci resistance zone could also be challenged this week by progress sighted during the resumption of the US-China trade negotiations, and from the domestic budget battle between President Trump and his Democratic rivals over the issue of funding border security and a wall.
Will progress on, or positive comments about, the resolution of these issues propel ES and SPX above Fibonacci resistance? We shall find out in the hours and days directly ahead. The consequences for both bulls and bears figure to be significant.
