Home Depot Under the Technical Microscope This AM
Mptrader Out Front: Tuesday April 6th, 2021
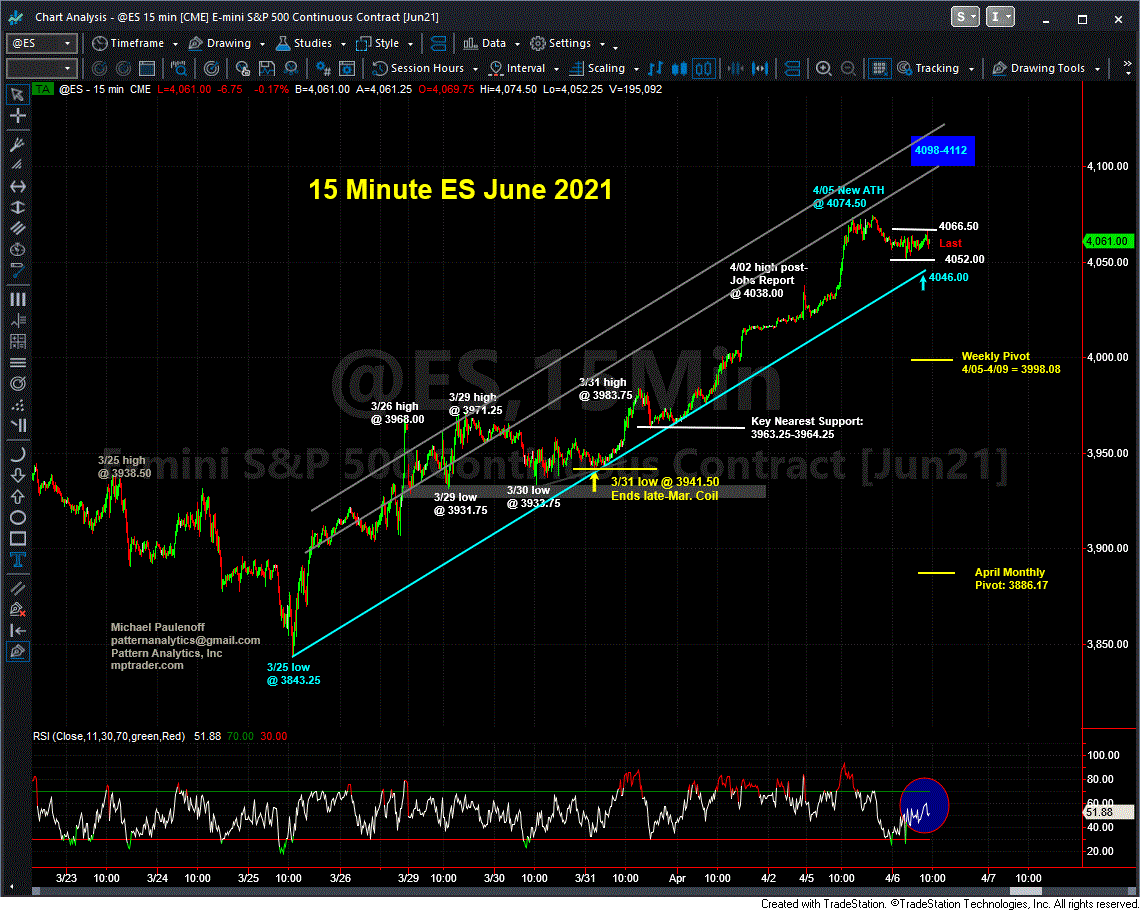
If today has potential to become a Turnaround Tuesday, so far the equity futures indices are not showing much if any sign of weakness. In fact, based on my attached 15 Minute ES Chart, all of the action off of yest.'s new ATH at 4074.50 into this AM's pre-market session sets up at the moment as another high level bullish digestion period and pattern, ahead of upside continuation.
As long as key nearest consequential support from 4052.00 to 4046.00 contains any forthcoming weakness, the bulls remain in directional control, with their sights set next on the 4100 target zone (4098 to 4112 to be more granular about it)... Last is 4060.50...
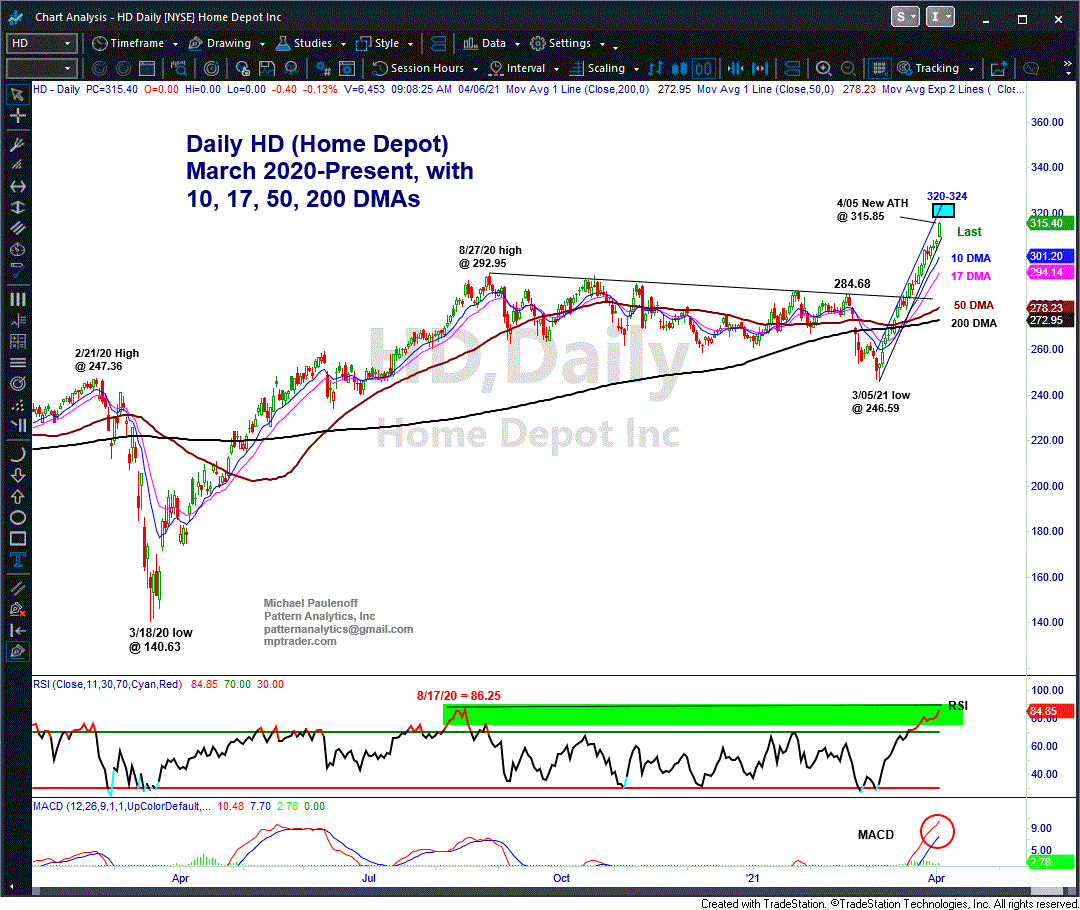
One incredible chart pattern is HD, which by my calculation, has closed higher on 18 of the last 21 trading days off of its 3/05 pivot low at 246.59 (see my attached Daily Chart). The near-vertical 28% upmove from 246.59 to 315.85 in the last four weeks has propelled HD Daily Momentum into moderately Overbought condition, but not to a level above the Momentum peak hit at the peak of the March-August 2020 advance from 140.63 to 292.95.
I will be interested to see if HD can climb still higher, generating a new high in Momentum to confirm that the upleg off of the 3/05/21 low is NOT the final upmove within the larger advance off of the March 2020 low.
While my near term pattern work argues that HD points still higher into the 318 to 322 target zone, the question is whether Momentum also climbs to a new high above 86.25 on a closing basis to confirm the new ATH?
If not, then economic bellwether HD will be sending a technical warning signal to investors that it has exhausted its upmove from the March 2020 low.
Key nearest term support in HD is 312.50 to 311.50, and if violated and sustained, will trigger preliminary warning signals that HD could be suffering from exhaustion. A decline that breaks and sustains beneath 308.00 will represent a secondary negative omen that HD is exhausted on the upside, and is increasingly vulnerable to a meaningful correction... Last is 314.85-315.00
DSI Readings as of Mon. Close (prior reading): SPX 90 (85)... NDQ 85 (77)... T-Bonds 29 (29)... VIX 9 (11)... DXY 56 (63)... Crude Oil 59 (0)... Gold 25 (0)... Silver 27 (0)... Copper 59 (0)... Corn 68 (0)... Beans 85 (0)... Coffee 12 (0)... Nikkei 90 (86)...
Consequential Economic Data This Week: Monday: Markit PMI (Final March)... ISM NYS... ISM Non-Mfg PMI (Mar)... Factor Orders... Treasury Secretary Yellen Speech 11 AM ET... Tuesday: JOLTS... API Crude Oil Inventory Report... Wednesday: Weekly Mortgage Applications... Balance of Trade... EIA Oil Inventory Report... G-20 Meeting... FOMC Minutes... Consumer Credit... Thursday: EIA Natural Gas Inventory Report... Initial and Continuing Jobless Claims... Friday: PPI... USDA WASDE (crop) Report... Baker Hughes Rig Count...


